#tcs trivia:
Last 5/ 5 times, next day after qtrly results, stock had Close < Open.
More from Pankaj DP
Except ici, none others went above O=H.
(I personally never trade based on O=H/ O=L; area is prone to spikes.)
But, when index & heavyweights have O=H at same time, it lends more credibility. -> today Gapup buyers were not in control.
(I personally never trade based on O=H/ O=L; area is prone to spikes.)
But, when index & heavyweights have O=H at same time, it lends more credibility. -> today Gapup buyers were not in control.
#nifty #hdfc #infy #hdfcbank #icicibank #tcs have nearly O=H. (Give or take few points)
— Pankaj DP (@voPAtrader) March 10, 2022
Rarely this happens.


More from Screeners

VWAP for intraday Trading Part -2
A small thread.
PART 1 - https://t.co/ooxepHpYKL
Traders show your support by like & retweet to benefit all
@Mitesh_Engr @ITRADE191 @ProdigalTrader @nakulvibhor @RajarshitaS @Puretechnicals9 @AnandableAnand @Anshi_________ @ca_mehtaravi

Chart 1
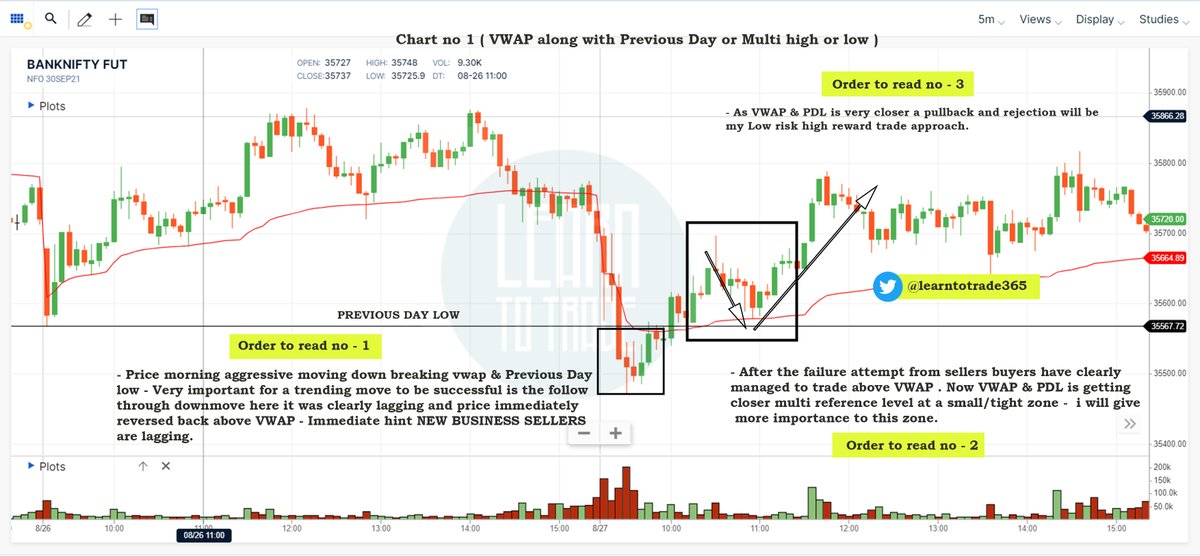
Chart 2
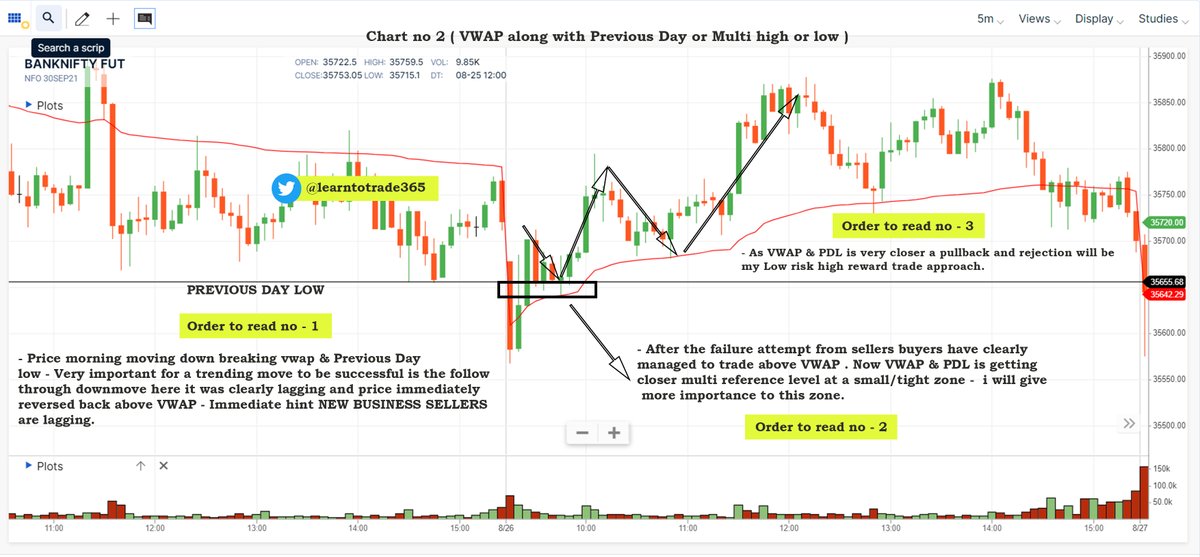
Chart 3
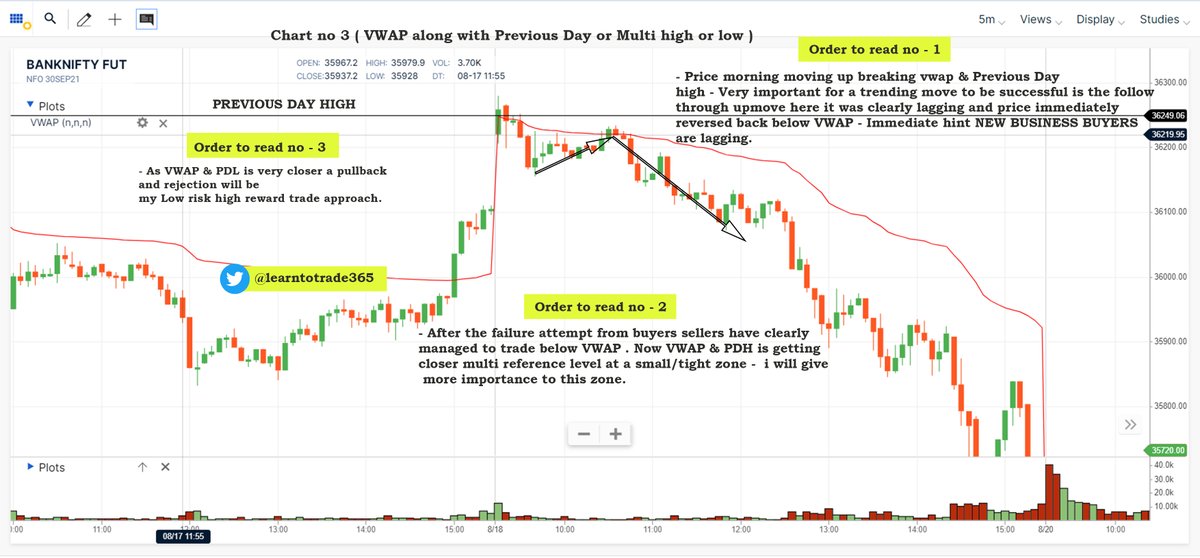
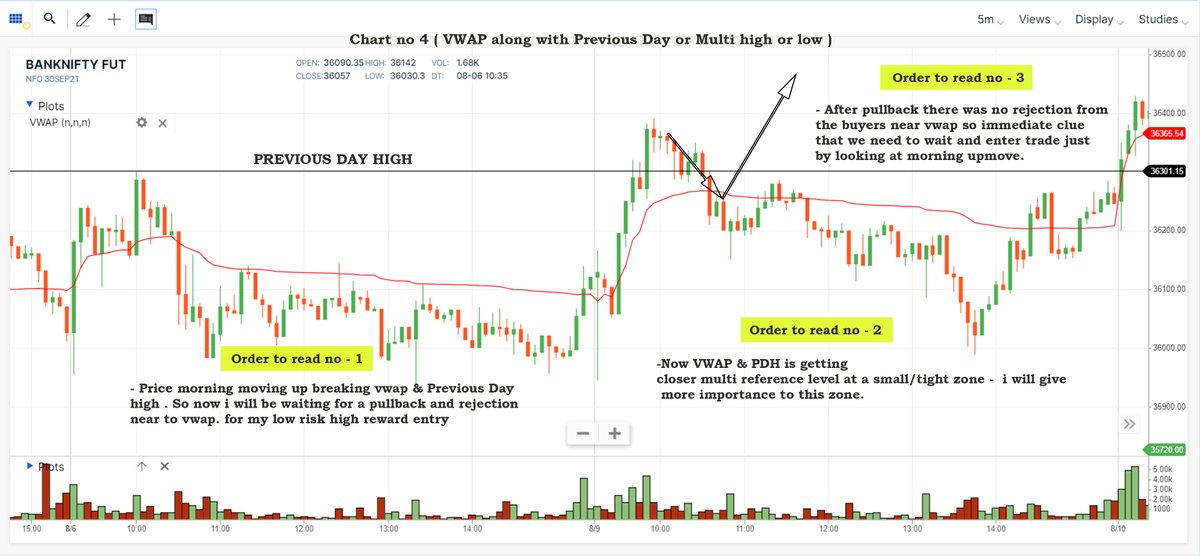
Chart 4
A small thread.
PART 1 - https://t.co/ooxepHpYKL
Traders show your support by like & retweet to benefit all
@Mitesh_Engr @ITRADE191 @ProdigalTrader @nakulvibhor @RajarshitaS @Puretechnicals9 @AnandableAnand @Anshi_________ @ca_mehtaravi
VWAP for intraday Trading Part -1
— Learn to Trade (@learntotrade365) August 28, 2021
A small thread PART -2 will be released tomorrow
Traders show your support by like & retweet to benefit all@Mitesh_Engr @ITRADE191 @ProdigalTrader @nakulvibhor @ArjunB9591 @CAPratik_INDIAN @RajarshitaS @Stockstudy8 @vivbajaj @Prakashplutus pic.twitter.com/y8bwisM4hB
Chart 1
Chart 2
Chart 3
Chart 4


History tells us when #USDINR moves it moves a lot. In that context it has been remarkably resilient with just 8% depreciation. It looks like we are very close to the point from where Rupee will start to appreciating again.
BTW Nifty Metal has inverse correlation with USDINR. https://t.co/X6cqVcYF3V
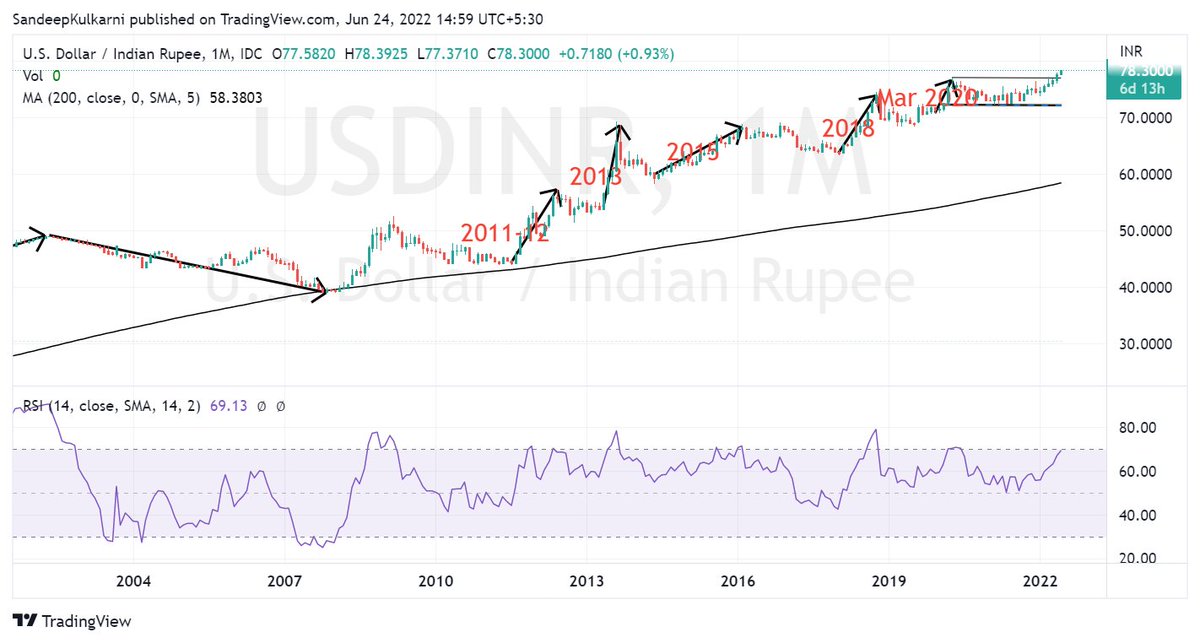
BTW Nifty Metal has inverse correlation with USDINR. https://t.co/X6cqVcYF3V
We know how our stock market has weathered the FII selling.
— Sandeep Kulkarni (@moneyworks4u_fa) June 10, 2022
But the equally big story is how Rupee has weathered $50bn+ outflows since Oct 2021. Hats off to RBI Governor Das & his team for having the vision of building huge reserves in his tenure. pic.twitter.com/CVuF9dM361


![Peter McCormack [Jan/3\u279e\u20bf \U0001f511\u220e]](https://pbs.twimg.com/profile_images/1524287442307723265/_59ITDbJ_normal.jpg)