How to know bottom formed?
As per classical tech analysis
Whenever daily RSI starts trading above weekly RSI. Consider it as short term bottom
When weekly RSI, above monthly RSI midium term bottom
Now daily RSI 30
Weekly 37
Monthly 59
@bankniftydoctor ..RSI king.view pl
I will do either
— Discipline TrendFollower\U0001f600 (@SouravSenguptaI) March 7, 2022
1.Monthly RSI near 40 ( presently 58)..Did nearly 20 yr backtesting
Or
2 A close above 17350 ( monthly)..This will confirm HH Structure
Levels r as of now
More from Discipline TrendFollower😀
I am following very simple trading plan based mainly on RSI and ADX.
— Dr.Jignesh Shah (@bankniftydoctor) January 27, 2019
Now whenever we wants to initiate trade then firstly we have to decide BIAS for direction.
BIAS based on RSI as follows-
RSI Above 55-Long.
RSI below 45-short.
RSI between 45-55\u2014- neutral.
Continue
Thanks brother for this & sharing it in public domain.
👍👍
As informed, this thread contains the #ChartinkScanners on the basis of which the traders can select stocks for their watchlist to trade. But nowhere is a Buy/Sell/Hold reco list. Pls Retweet for max reach. https://t.co/ezl0XffNbU
— H@\u20b9i$H \U0001f1ee\U0001f1f3 (@harrie007) June 26, 2020
Pl find enclosed a general FAQ prepared earlier & I hope it could be useful
Any query is welcome
#trendfollowing
I have tried to prepare (best of my knowledge) a small FAQ on Trendfollowing. For more details you may read https://t.co/E5JE81huNA by @Covel
— Discipline TrendFollower\U0001f600 (@SouravSenguptaI) July 12, 2020
Also liberty of tagging @WeekendInvestng
& @Trendmyfriends whome, I consider as best TF in India
Slightly length..But do read it
More from Screeners


#BroTip
If you want to trade only stocks with established trend/momentum, then you can look for stocks which have never(or barely did) closed below a certain MA (say 50MA) in the last say 50 days.
— Manas Arora (@iManasArora) November 8, 2021
There are countless ways to run scans. Just have to get creative. #BroTip

Covering one of the most unique set ups: Extended moves & Reversal plays
Time for a 🧵 to learn the above from @iManasArora
What qualifies for an extended move?
30-40% move in just 5-6 days is one example of extended move
How Manas used this info to book
The stock exploded & went up as much as 63% from my price.
— Manas Arora (@iManasArora) June 22, 2020
Closed my position entirely today!#BroTip pic.twitter.com/CRbQh3kvMM
Post that the plight of the
What an extended (away from averages) move looks like!!
— Manas Arora (@iManasArora) June 24, 2020
If you don't learn to sell into strength, be ready to give away the majority of your gains.#GLENMARK pic.twitter.com/5DsRTUaGO2
Example 2: Booking profits when the stock is extended from 10WMA
10WMA =
#HIKAL
— Manas Arora (@iManasArora) July 2, 2021
Closed remaining at 560
Reason: It is 40+% from 10wma. Super extended
Total revenue: 11R * 0.25 (size) = 2.75% on portfolio
Trade closed pic.twitter.com/YDDvhz8swT
Another hack to identify extended move in a stock:
Too many green days!
Read
When you see 15 green weeks in a row, that's the end of the move. *Extended*
— Manas Arora (@iManasArora) August 26, 2019
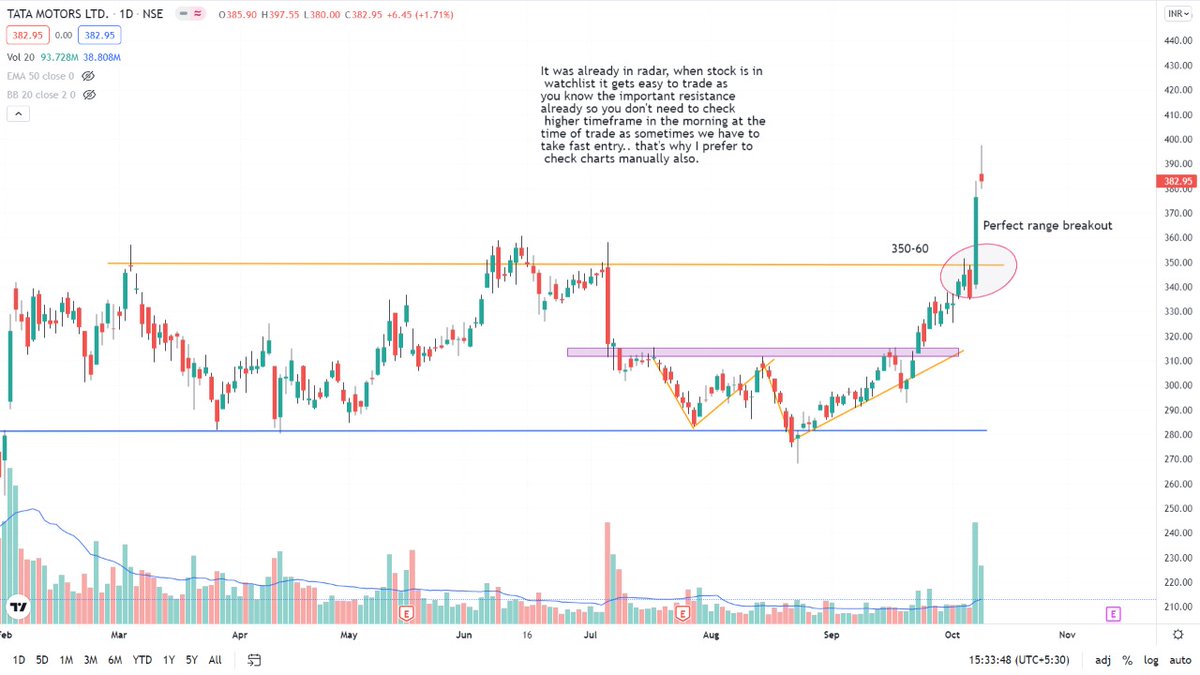
Simple price action analysis.#Seamecltd https://t.co/gR9xzgeb9K

Do read it completely to understand the stance and the plan.
This thread will present a highly probable scenario of markets for the upcoming months. Will update the scenario too if there is a significant change in view in between.
— Aakash Gangwar (@akashgngwr823) May 15, 2022
1/n https://t.co/jfWOyEgZyd
1. The moving average structure - Many traders just look at the 200 ma test or closing above/below it regardless of its slope. Let's look at all the interactions with 200 ma where price met it for the first time after the trend change but with 200 ma slope against it
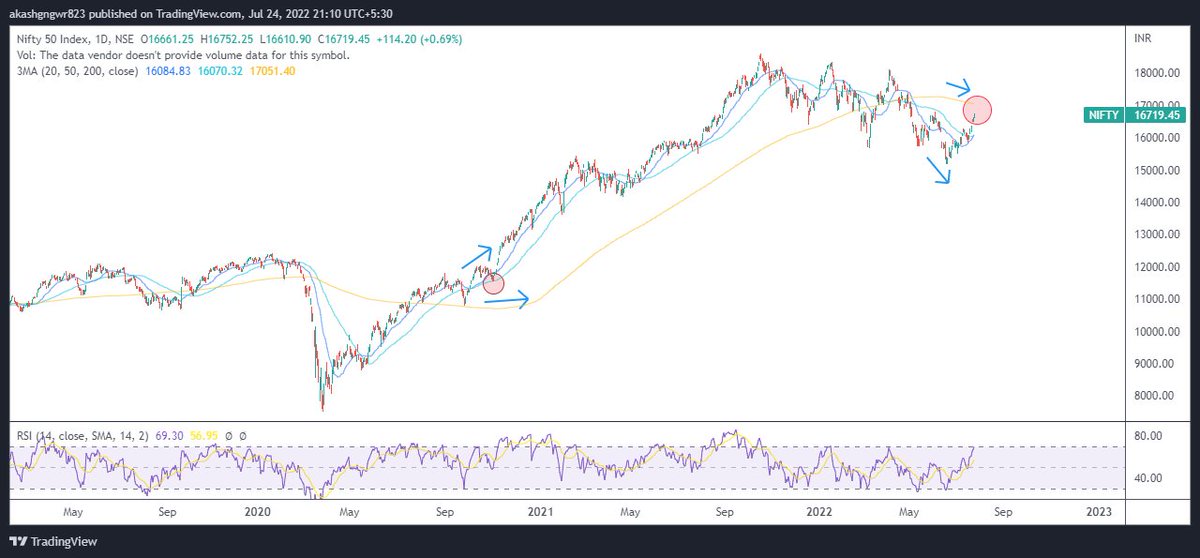
One can clearly sense that currently it is one of those scenarios only. I understand that I might get trolled for this, but an unbiased mind suggests that odds are highly against the bulls for making fresh investments.
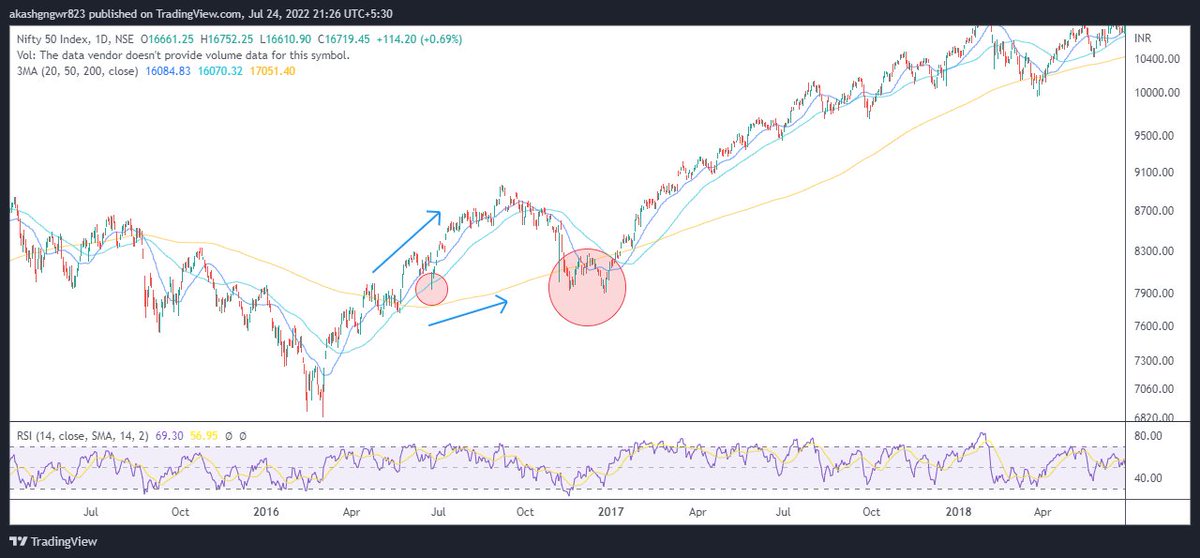
But markets are good at giving surprises. What should be our stance if price kept on rising? Let's understand that through charts. The concept is still the same. Divergent 200 ma and price move results in 200 ma test atleast once which gives good investment opportunities.
2. Zig-Zag bear market- There are two types of fall in a bear market, the first one is vertical fall which usually ends with ending diagonals (falling wedges) and the second one is zig zag one which usually ends with parabolic down moves.