https://t.co/MGKzygn1YW
So friends here is the thread on the recommended pathway for new entrants in the stock market.
Here I will share what I believe are essentials for anybody who is interested in stock markets and the resources to learn them, its from my experience and by no means exhaustive..
https://t.co/MGKzygn1YW

https://t.co/72M2DCPJHZ
https://t.co/uqJRvfkxb5
Old is Gold....
— Professor (@DillikiBiili) January 23, 2020
this Bharti Airtel chart is a true copy of the Wyckoff Pattern propounded in 1931....... pic.twitter.com/tQ1PNebq7d
First concepts to be learned are finding support and resistance on charts or price levels.
https://t.co/Q5njGt26zv
For breakouts, they are very very important !
https://t.co/kHK064D5z1
https://t.co/0qUaenJmAF
https://t.co/rWVkIEAphx
Here are most important ones.
https://t.co/KIITvSWsj0
This is his workbook on Technical Analysis https://t.co/2GrnycldWf
No need to buy expensive books on Technical Analysis.
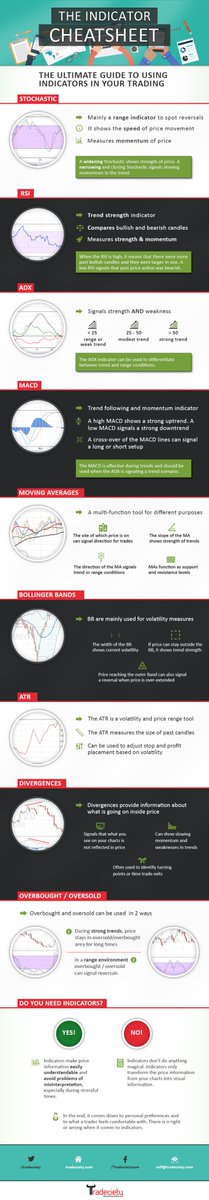
Trend indicators : For direction and strength
Momentum indicators : For the speed of price movement
Volatility Indicators : For measuring fluctuations
Volume Indicators : For measuring strength of trend based on volume traded

Thanks @bbands for this excellent tool.
https://t.co/W0UatdqXRw
An indicator cheat sheet is here
So once a person sees this light, he shifts to another gear increasingly trades on price Action, only occasionally taking support of indicators.
https://t.co/TSZXAMe196
Caution : These are only for advance readers.
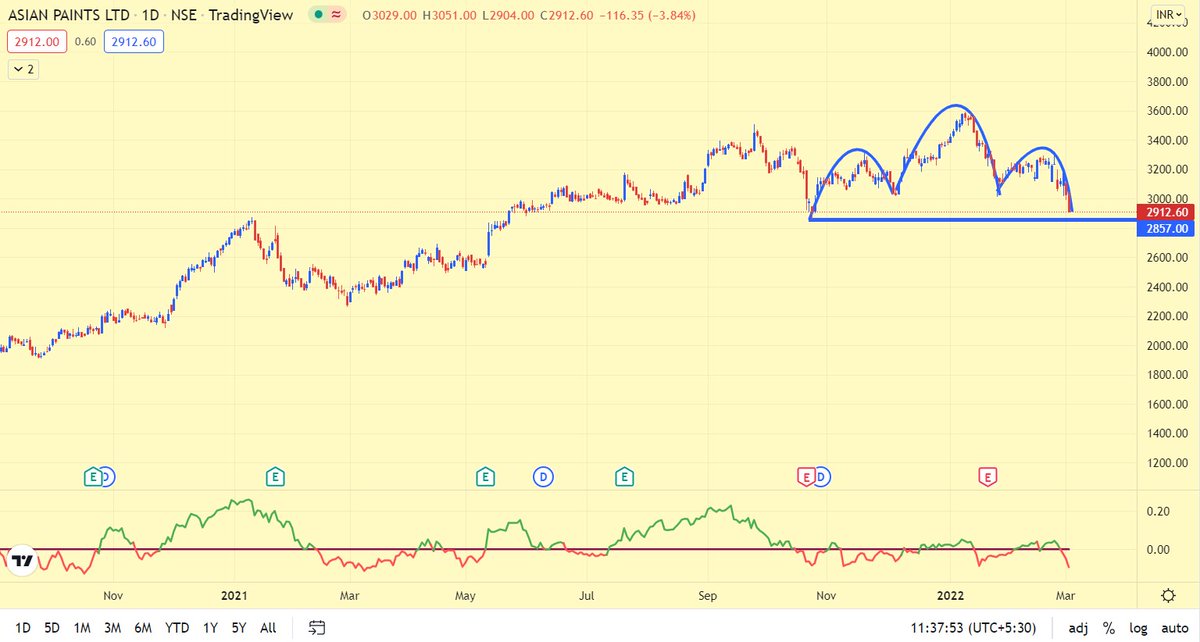
Accumulation, Distribution and Breakouts are regular feature in markets. One or the other is always happening in some stocks.
In Roaring Bull markets, Breakouts increase as now a days we are seeing daily.
And the breakout may be in upside or downside both. If it happens after accumulation, it will be a bullish breakout and after distribution, it'll be bearish breakout.
I simple love breakouts.
https://t.co/2rCmYFK1Yr
More from Professor
Asian Paints took a bounce exactly from the level given on 21st October.
It has string resistance at 3200, so fresh up-move will be confirmed only when it opens above 3220-3230 levels
#ASIANPAINT
#DKBPositional https://t.co/Q6fTbK5VHM
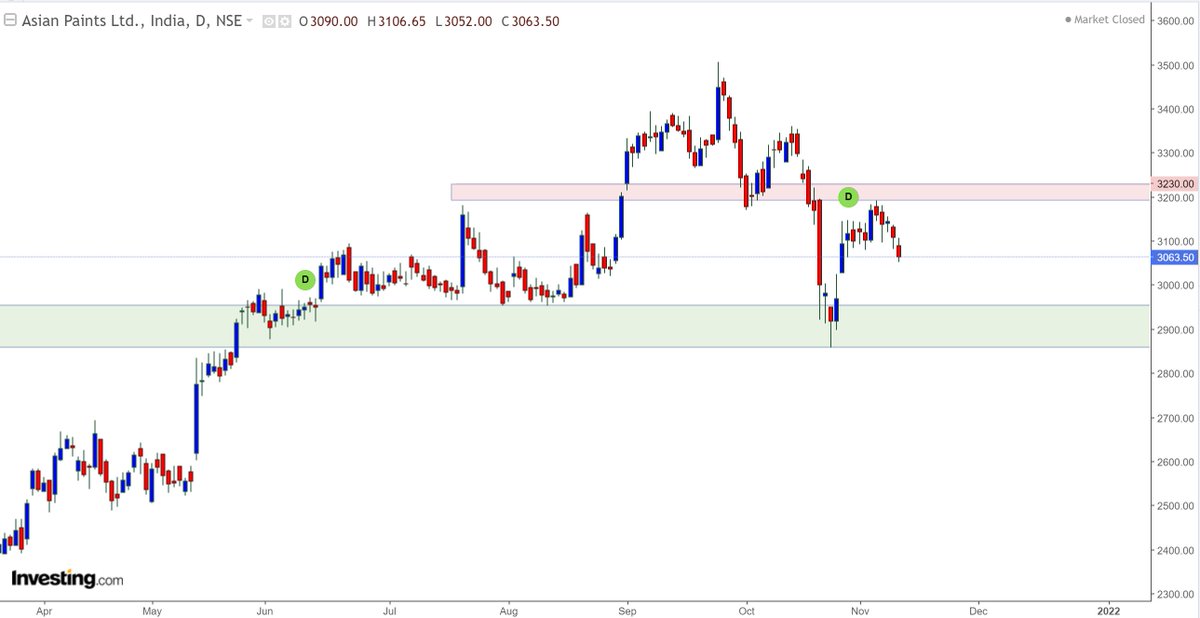
It has string resistance at 3200, so fresh up-move will be confirmed only when it opens above 3220-3230 levels
#ASIANPAINT
#DKBPositional https://t.co/Q6fTbK5VHM
Asian Paints also at crucial support line, bulls desperately need a reversal here, else it'll go in hibernation..... pic.twitter.com/VTfaMfpHXs
— Professor (@DillikiBiili) October 21, 2021
Jab tak ki meri book nahi aati, ye kar lo:
1. Go through Zerodha Varsity chapters on Technical Analysis at least 2 times.
2. Then read 'Technical Analysis Explained' by Martin Pring
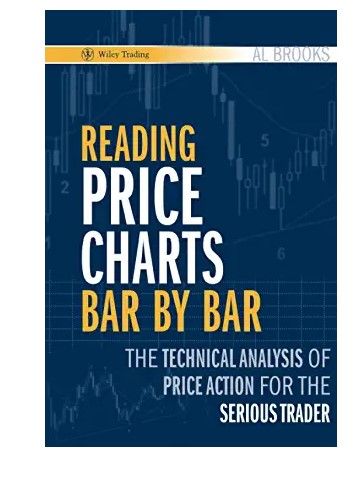
3. Finally read 'Price Action bar by bar' by Al Books (Not for casual reader).
1. Go through Zerodha Varsity chapters on Technical Analysis at least 2 times.
2. Then read 'Technical Analysis Explained' by Martin Pring
3. Finally read 'Price Action bar by bar' by Al Books (Not for casual reader).
Sir @DillikiBiili , could you please suggest a book for technical analysis ?
— Pawan Yadav (@pawan_yadav86) March 25, 2022
More from Screeners


And here it is:
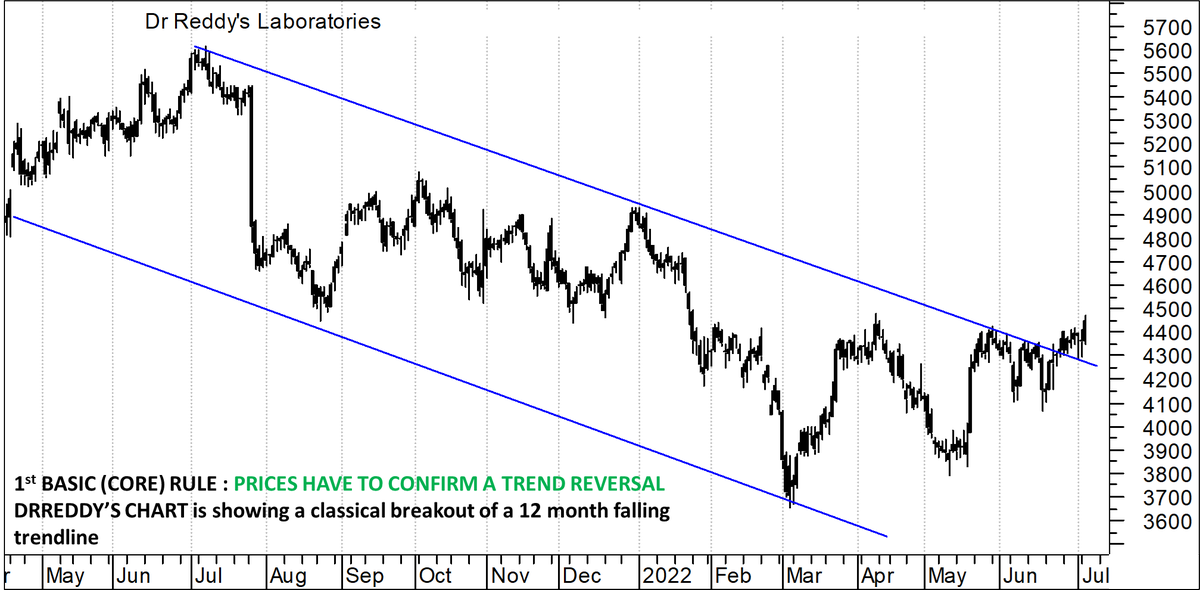
The 3 most important rules which I follow in spotting a major trend reversal laid out in this stock, 'as it is'.
1. Trend reversal
2. Price patterns
3. Indicator confirmation
Perfect TA chart.
All boxes ticked !!
Do comment, like and share !!!
#DRREDDY https://t.co/4JGg71GenE
The 3 most important rules which I follow in spotting a major trend reversal laid out in this stock, 'as it is'.
1. Trend reversal
2. Price patterns
3. Indicator confirmation
Perfect TA chart.
All boxes ticked !!
Do comment, like and share !!!
#DRREDDY https://t.co/4JGg71GenE
Today at 2 pm:
— Kunal Bothra (@kbbothra) July 5, 2022
I will bring to you one of the SUPER FINEST TECHNICAL CHART setup on a largecap name.
Agar yeh nahi chal paya toh kuch nahi chal paayega\u2026
Retweeet tsunami has to come for this one\u2026 #stock #breakout #technical


You May Also Like


I hate when I learn something new (to me) & stunning about the Jeff Epstein network (h/t MoodyKnowsNada.)
Where to begin?
So our new Secretary of State Anthony Blinken's stepfather, Samuel Pisar, was "longtime lawyer and confidant of...Robert Maxwell," Ghislaine Maxwell's Dad.
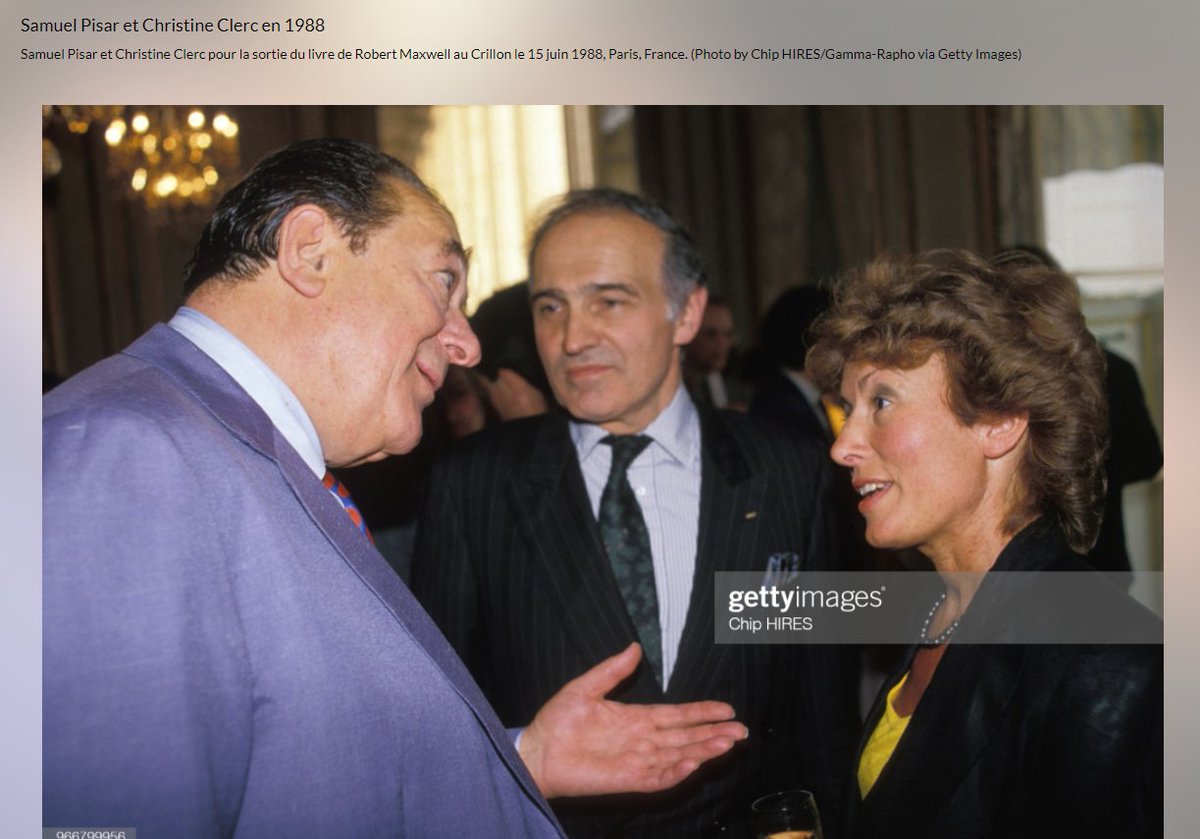
"Pisar was one of the last people to speak to Maxwell, by phone, probably an hour before the chairman of Mirror Group Newspapers fell off his luxury yacht the Lady Ghislaine on 5 November, 1991." https://t.co/DAEgchNyTP
OK, so that's just a coincidence. Moving on, Anthony Blinken "attended the prestigious Dalton School in New York City"...wait, what? https://t.co/DnE6AvHmJg
Dalton School...Dalton School...rings a
Oh that's right.
The dad of the U.S. Attorney General under both George W. Bush & Donald Trump, William Barr, was headmaster of the Dalton School.
Donald Barr was also quite a
I'm not going to even mention that Blinken's stepdad Sam Pisar's name was in Epstein's "black book."
Lots of names in that book. I mean, for example, Cuomo, Trump, Clinton, Prince Andrew, Bill Cosby, Woody Allen - all in that book, and their reputations are spotless.
Where to begin?
So our new Secretary of State Anthony Blinken's stepfather, Samuel Pisar, was "longtime lawyer and confidant of...Robert Maxwell," Ghislaine Maxwell's Dad.
"Pisar was one of the last people to speak to Maxwell, by phone, probably an hour before the chairman of Mirror Group Newspapers fell off his luxury yacht the Lady Ghislaine on 5 November, 1991." https://t.co/DAEgchNyTP
OK, so that's just a coincidence. Moving on, Anthony Blinken "attended the prestigious Dalton School in New York City"...wait, what? https://t.co/DnE6AvHmJg
Dalton School...Dalton School...rings a
Oh that's right.
The dad of the U.S. Attorney General under both George W. Bush & Donald Trump, William Barr, was headmaster of the Dalton School.
Donald Barr was also quite a
Donald Barr had a way with words. pic.twitter.com/JdRBwXPhJn
— Rudy Havenstein, listening to Nas all day. (@RudyHavenstein) September 17, 2020
I'm not going to even mention that Blinken's stepdad Sam Pisar's name was in Epstein's "black book."
Lots of names in that book. I mean, for example, Cuomo, Trump, Clinton, Prince Andrew, Bill Cosby, Woody Allen - all in that book, and their reputations are spotless.