1/ Today is #BlackHoleFriday, an annual science outreach event that, by complete coincidence I’m sure, is done on #BlackFriday. You’ll read lots of cool stuff about black holes on the hashtag. Here’s mine.

https://t.co/QetnodyE72
#BlackHoleFriday
More from Science

💥💥 Situation Update, Dec. 7th – DNI John Ratcliffe, the bogus science of PCR testing and China’s GMO super soldiers
✅ I cover the bogus science behind PCR testing, explaining from a lab science point of view why no PCR instrument can “quantify” anything,
[M. Adams]

1. whether it’s a coronavirus viral load or the percentage of a food that’s GMO. In fact, literally all the tests currently conducted with PCR equipment are scientifically invalid when it comes to diagnosing illness or determining infectiousness. The sample acquisition used for
2. PCR tests — nasal swabs — aren’t even standardized! (100% bogus junk science).
After covering PCR tests, today’s update then goes into detail about Director of National Intelligence (DNI) John Ratcliffe, pointing out that he will be issuing a report on foreign interference
3. in U.S. elections on or before Dec. 18th. If this report confirms the existence of foreign interference that was capable of altering the outcome of the election, it gives President Trump full justification to declare the election null and void and dispatch military troops
4. to seize all ballots and hold a new count under military authority.
👉 Podcast notes and sources:
The office of military commissions has cleared its calendar for December:
https://t.co/u4nFRiUj8m
US military STOCKPILED Pfizer’s mRNA vaccineBEFORE it was approved by theFDA
✅ I cover the bogus science behind PCR testing, explaining from a lab science point of view why no PCR instrument can “quantify” anything,
[M. Adams]
1. whether it’s a coronavirus viral load or the percentage of a food that’s GMO. In fact, literally all the tests currently conducted with PCR equipment are scientifically invalid when it comes to diagnosing illness or determining infectiousness. The sample acquisition used for
2. PCR tests — nasal swabs — aren’t even standardized! (100% bogus junk science).
After covering PCR tests, today’s update then goes into detail about Director of National Intelligence (DNI) John Ratcliffe, pointing out that he will be issuing a report on foreign interference
3. in U.S. elections on or before Dec. 18th. If this report confirms the existence of foreign interference that was capable of altering the outcome of the election, it gives President Trump full justification to declare the election null and void and dispatch military troops
4. to seize all ballots and hold a new count under military authority.
👉 Podcast notes and sources:
The office of military commissions has cleared its calendar for December:
https://t.co/u4nFRiUj8m
US military STOCKPILED Pfizer’s mRNA vaccineBEFORE it was approved by theFDA


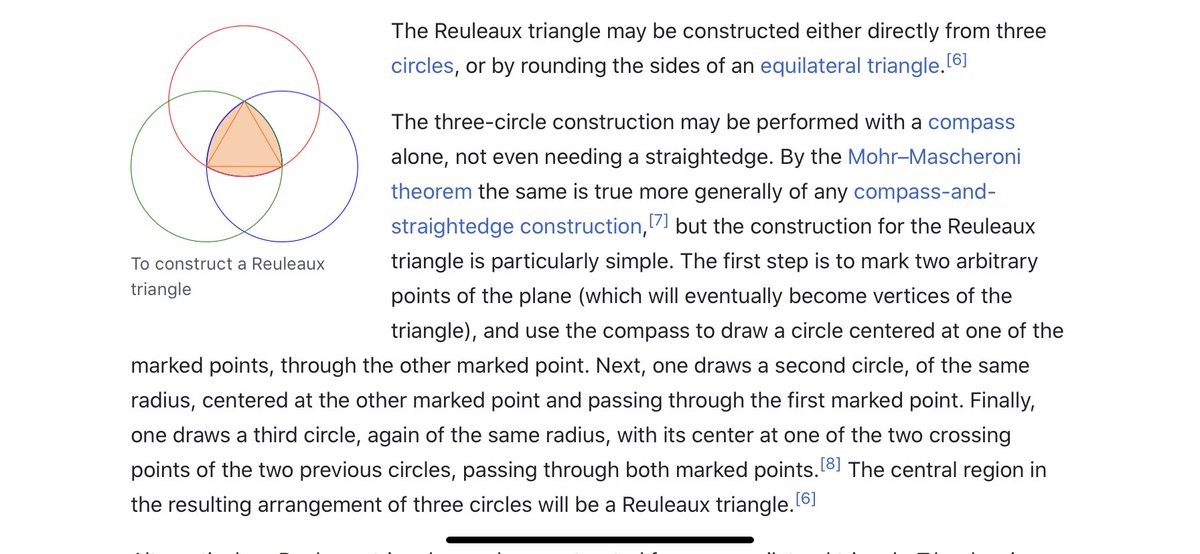
I think we have to expand our thinking about the toroidal sphere even more. When looking at maps, I noticed the da Vinci map, from 1514, which uses the Reuleaux Triangle. This triangle is formed from 3 intersecting circles, and is in the center of a trefoil.
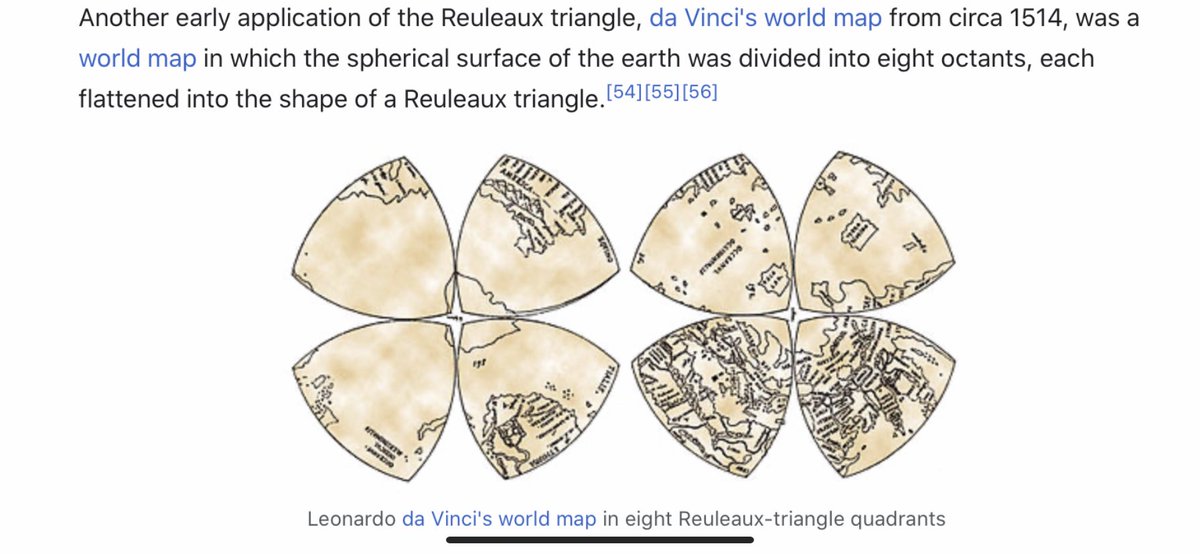
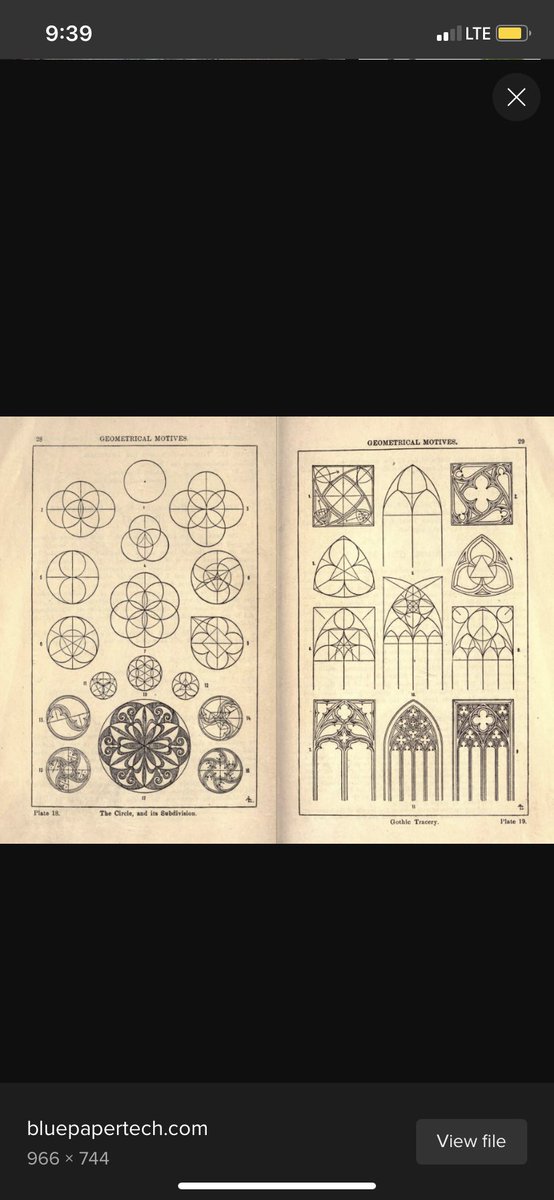
The trefoil is the focal point in many gothic structures, repeatedly and prominently shown. It is represented in many ways. ‘Going down the rabbit hole’ now makes sense, if you understand the center point of the ears is the center of the torus, with the rabbit trefoil.
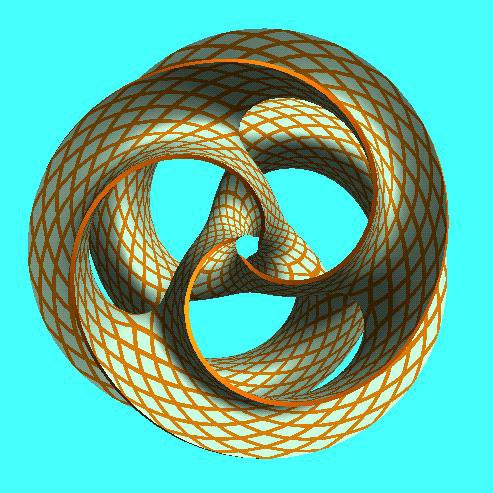
The trefoil can be found within the toroidal field. Here is a fun site, where you can manipulate it yourself. https://t.co/FCMcybuuFC
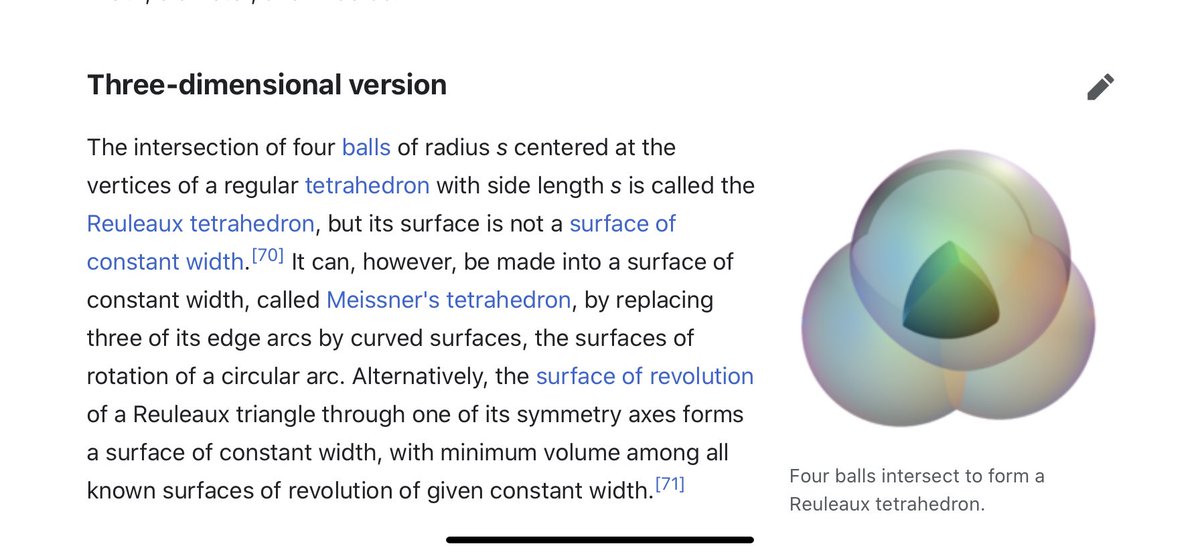
The wiki page makes it seem like there isn’t much of importance with the Reuleaux Triangle, besides being used for coinage, or some stupid bike. But the Wankel engine is an interesting engine, using this geometric design https://t.co/ayPOgkAqGN
https://t.co/m9EaWwF796
The trefoil is the focal point in many gothic structures, repeatedly and prominently shown. It is represented in many ways. ‘Going down the rabbit hole’ now makes sense, if you understand the center point of the ears is the center of the torus, with the rabbit trefoil.
The trefoil can be found within the toroidal field. Here is a fun site, where you can manipulate it yourself. https://t.co/FCMcybuuFC
The wiki page makes it seem like there isn’t much of importance with the Reuleaux Triangle, besides being used for coinage, or some stupid bike. But the Wankel engine is an interesting engine, using this geometric design https://t.co/ayPOgkAqGN
https://t.co/m9EaWwF796