

1/ #LBBB generates often a classical pattern on #EchoFirst. The pattern is very distinctive in Tissue Doppler of the septum.


More from Science


Hugh Everett's birthday! Pioneer of the Many-Worlds Interpretation of quantum mechanics. Let us celebrate by thinking about ontological extravagance. I will do so by way of analogy, because I have found that everyone loves analogies and nobody ever willfully misconstrues them.
We look at the night sky and see photons arriving to us, emitted by distant stars. Let's contrast two different theories about how stars emit photons.
One theory says, we know how stars shine, and our equations predict that they emit photons roughly uniformly in all directions. Call this the "Many-Photons Interpretation" (MPI).
But! Others object. That is *so many photons*. Most of which we don't observe, and can't observe, since they're moving away at the speed of light. It's too ontologically extravagant to posit a huge number of unobservable things!
So they suggest a "Photon Collapse Interpretation." According to this theory, the photons emitted toward us actually exist. But photons that would be emitted in directions we will never observe simply collapse into utter non-existence.
The physicist Hugh Everett III was born #OTD in 1930. His \u201crelative state\u201d formulation of quantum mechanics, which we now call the \u201cMany Worlds Interpretation,\u201d was published in 1957. pic.twitter.com/ZqMsZcPJDG
— Robert McNees, the bastegod (@mcnees) November 11, 2020
We look at the night sky and see photons arriving to us, emitted by distant stars. Let's contrast two different theories about how stars emit photons.
One theory says, we know how stars shine, and our equations predict that they emit photons roughly uniformly in all directions. Call this the "Many-Photons Interpretation" (MPI).
But! Others object. That is *so many photons*. Most of which we don't observe, and can't observe, since they're moving away at the speed of light. It's too ontologically extravagant to posit a huge number of unobservable things!
So they suggest a "Photon Collapse Interpretation." According to this theory, the photons emitted toward us actually exist. But photons that would be emitted in directions we will never observe simply collapse into utter non-existence.




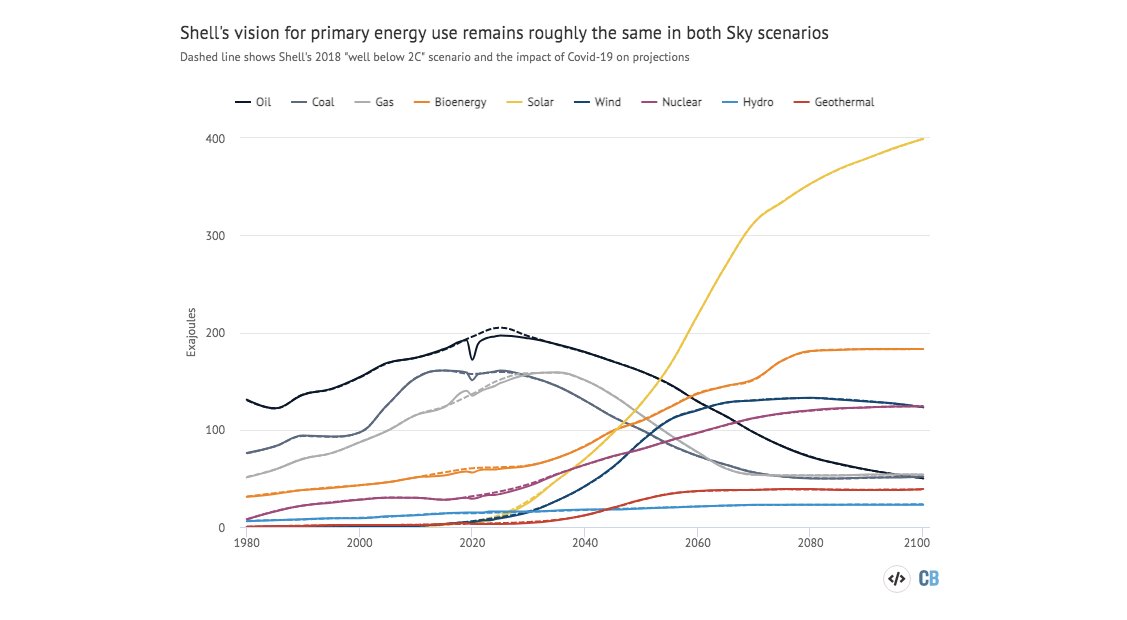
I took a look at Shell's first ever 1.5C scenario and found that it is... remarkably similar to its “well-below 2C” scenario.
Oil, gas, coal, solar.... all basically unchanged.
The key difference: A new forest the size of Brazil to suck up the extra CO2.
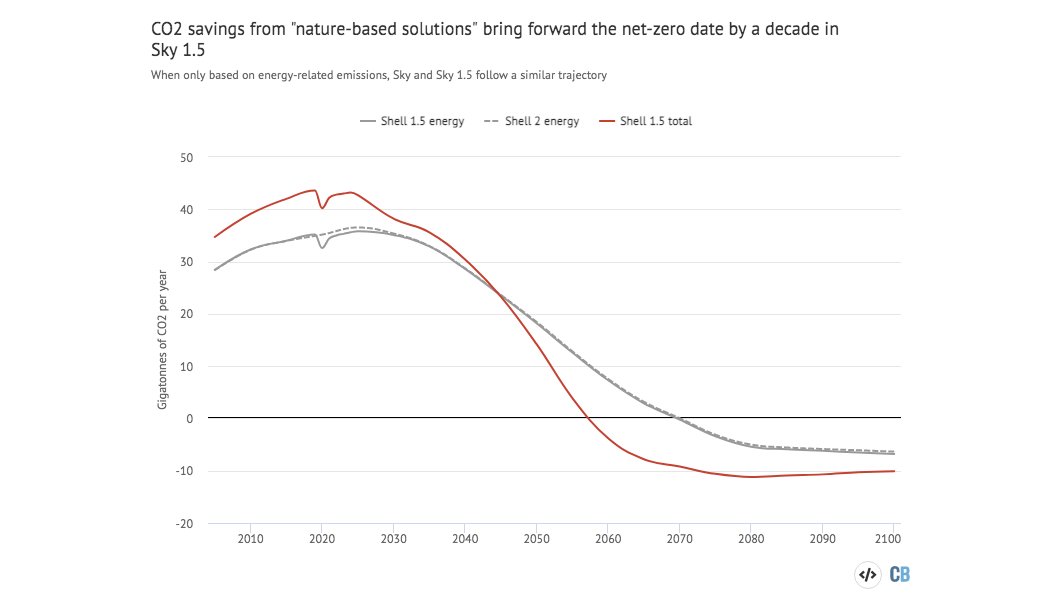
Including "nature-based solutions" in the outlook brings forward the date for net-zero emissions to 2058.
Without them their pathway for CO2 emissions is the same as the previous one.
(It's also towards the higher end of 1.5C emissions pathways.)
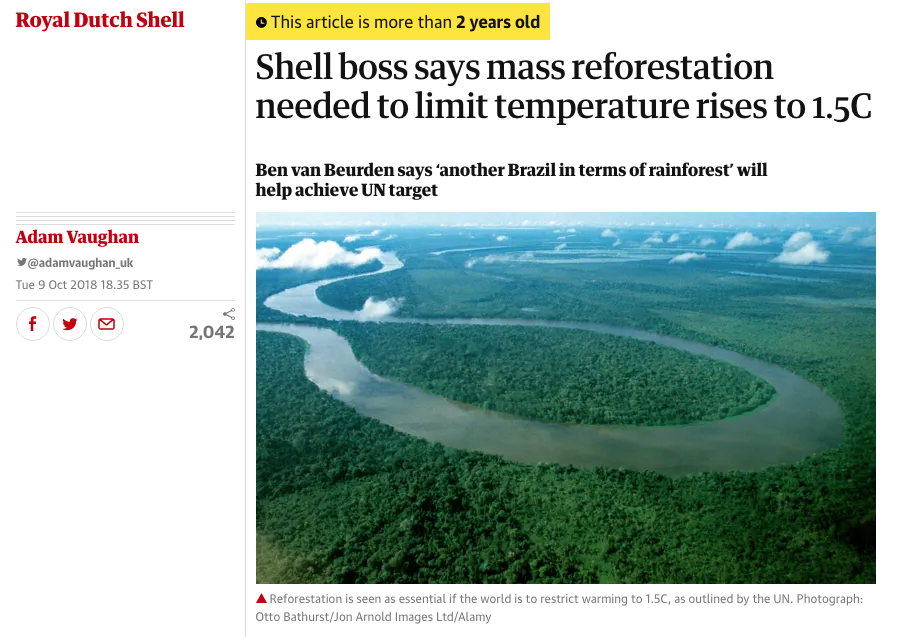
The "Brazil-sized" forest idea isn't actually new, it has been kicking around for a couple of years.
It was referenced in the "well-below 2C" scenario although not formally included in it, and Shell's CEO has been framing it as the only viable way of getting to 1.5C.
Fine, but who is going to plant all those trees? Well... Shell says it will plant some of them.
Only yesterday Shell said forests were a key part of its net-zero strategy.
Not everyone is convinced though
https://t.co/RaJm7tOHxb
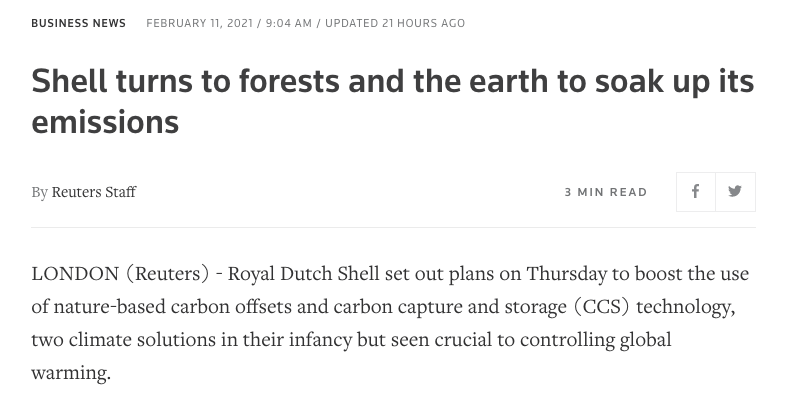
Given that Shell's 1.5C scenario also sees a big scaling up of bioenergy, the question remains: where are all those trees and bioenergy crops going to go?
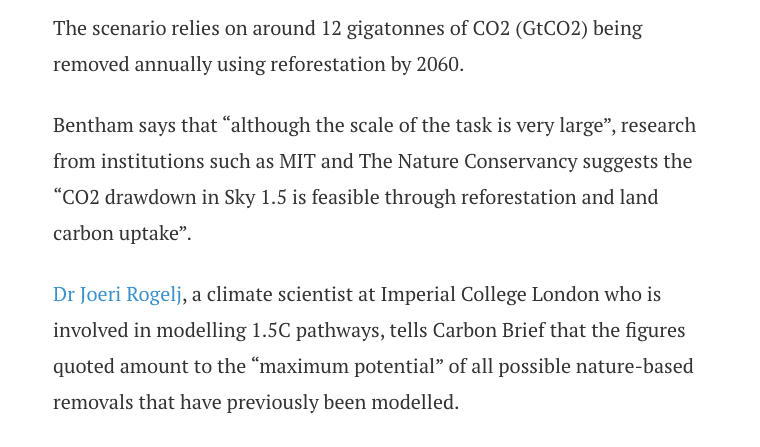
Oil, gas, coal, solar.... all basically unchanged.
The key difference: A new forest the size of Brazil to suck up the extra CO2.
Including "nature-based solutions" in the outlook brings forward the date for net-zero emissions to 2058.
Without them their pathway for CO2 emissions is the same as the previous one.
(It's also towards the higher end of 1.5C emissions pathways.)
The "Brazil-sized" forest idea isn't actually new, it has been kicking around for a couple of years.
It was referenced in the "well-below 2C" scenario although not formally included in it, and Shell's CEO has been framing it as the only viable way of getting to 1.5C.
Fine, but who is going to plant all those trees? Well... Shell says it will plant some of them.
Only yesterday Shell said forests were a key part of its net-zero strategy.
Not everyone is convinced though
https://t.co/RaJm7tOHxb
Shell plans to use forests to remove 120 Mt/yr of CO2 by 2030.
— Greg Muttitt (@FuelOnTheFire) February 12, 2021
Appropriate land for forestation is finite, and risks competition with food production and human rights of current land owners/users, esp Indigenous
Given that Shell's 1.5C scenario also sees a big scaling up of bioenergy, the question remains: where are all those trees and bioenergy crops going to go?
You May Also Like





A THREAD ON @SarangSood
Decoded his way of analysis/logics for everyone to easily understand.
Have covered:
1. Analysis of volatility, how to foresee/signs.
2. Workbook
3. When to sell options
4. Diff category of days
5. How movement of option prices tell us what will happen
1. Keeps following volatility super closely.
Makes 7-8 different strategies to give him a sense of what's going on.
Whichever gives highest profit he trades in.
2. Theta falls when market moves.
Falls where market is headed towards not on our original position.
3. If you're an options seller then sell only when volatility is dropping, there is a high probability of you making the right trade and getting profit as a result
He believes in a market operator, if market mover sells volatility Sarang Sir joins him.
4. Theta decay vs Fall in vega
Sell when Vega is falling rather than for theta decay. You won't be trapped and higher probability of making profit.
Decoded his way of analysis/logics for everyone to easily understand.
Have covered:
1. Analysis of volatility, how to foresee/signs.
2. Workbook
3. When to sell options
4. Diff category of days
5. How movement of option prices tell us what will happen
1. Keeps following volatility super closely.
Makes 7-8 different strategies to give him a sense of what's going on.
Whichever gives highest profit he trades in.
I am quite different from your style. I follow the market's volatility very closely. I have mock positions in 7-8 different strategies which allows me to stay connected. Whichever gives best profit is usually the one i trade in.
— Sarang Sood (@SarangSood) August 13, 2019
2. Theta falls when market moves.
Falls where market is headed towards not on our original position.
Anilji most of the time these days Theta only falls when market moves. So the Theta actually falls where market has moved to, not where our position was in the first place. By shifting we can come close to capturing the Theta fall but not always.
— Sarang Sood (@SarangSood) June 24, 2019
3. If you're an options seller then sell only when volatility is dropping, there is a high probability of you making the right trade and getting profit as a result
He believes in a market operator, if market mover sells volatility Sarang Sir joins him.
This week has been great so far. The main aim is to be in the right side of the volatility, rest the market will reward.
— Sarang Sood (@SarangSood) July 3, 2019
4. Theta decay vs Fall in vega
Sell when Vega is falling rather than for theta decay. You won't be trapped and higher probability of making profit.
There is a difference between theta decay & fall in vega. Decay is certain but there is no guaranteed profit as delta moves can increase cost. Fall in vega on the other hand is backed by a powerful force that sells options and gives handsome returns. Our job is to identify them.
— Sarang Sood (@SarangSood) February 12, 2020


