Categories Politics
7 days
30 days
All time
Recent
Popular


I'm kind of surprised I haven't seen an article in @FiveThirtyEight or somewhere similar using the Total Survey Error framework as a tool for categorizing potential sources of survey error and tests for those hypotheses as election results get finalized.
When survey researchers hear about "Shy Trump" voters, we hear it as measurement error, and there's good evidence that it's vanishingly small. But I think the broader public might also be including non-response error as part of how they understand that term

As we unpack the sources of survey error, it's worth keeping our eye on some patterns. For instance, this comparison of survey averages to projected results by @gelliottmorris shows a correlation between 2016 and 2020, but also an intercept shift

Putting out some hypotheses now that can be tested as vote counts get finalized (still not done counting!) and pollsters look back at their own data
1) Everything @davidshor says here about trust and non-response: https://t.co/aXYZMc5QO5
It's tricky to test for, because surveys aren't asking about trust and we don't have great national benchmarks either. That said ...
When survey researchers hear about "Shy Trump" voters, we hear it as measurement error, and there's good evidence that it's vanishingly small. But I think the broader public might also be including non-response error as part of how they understand that term
As we unpack the sources of survey error, it's worth keeping our eye on some patterns. For instance, this comparison of survey averages to projected results by @gelliottmorris shows a correlation between 2016 and 2020, but also an intercept shift
Putting out some hypotheses now that can be tested as vote counts get finalized (still not done counting!) and pollsters look back at their own data
1) Everything @davidshor says here about trust and non-response: https://t.co/aXYZMc5QO5
It's tricky to test for, because surveys aren't asking about trust and we don't have great national benchmarks either. That said ...

Read it. Understand the data plots. And tell me it doesn't leave a bad taste in your mouth. If it doesn't leave a bad taste in your mouth, tell me why.
Takes vote dumps in each state & plots ratios of Biden votes to Trump. Then draws three lines showing that if a data plot is above the line then it is in either the 95th percentile, 99th percentile, or 99.5th percentile. IOW, only one out of every two-hundred points are above it.
The study takes into account that large ballot dumps which heavily favor a candidate make sense, if there are also smaller ones which favor the candidate more. Seems logical. Larger data dumps should be smoother than smaller data dumps.
All states except MI/WI/GA are blue. Notice anything? Notice how the controversial and much needed dumps for Biden that happened in the wee hours of the morning in crucial states are the most unlikely of all data dumps?

Might say these were mail in ballots that were expected to heavily favor Biden. Why don't we see this in other states that weren't absolutely crucial to Biden's victory coming down the stretch? Why are these three states the most extreme? Why not heavy blue areas like NYC or SF?
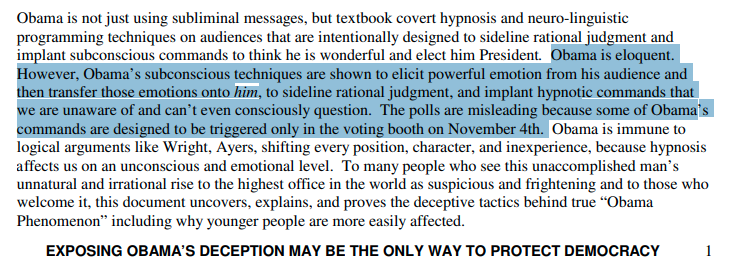
A SINGLE VERIFIED FACT
— David Baker Fight Like A Flynn (@IWasHrren) November 26, 2020
That proves VOTER FRAUD
in GEORGIA, without a doubt.
Trump was ahead. The vote counting was stopped-
BECAUSE A WATER PIPE BURST
Then Biden caught up
The water pipe
DID NOT BURST \U0001f448FACT
The Definitive Case Proving Donald Trump Won https://t.co/ZZZWChwKeP
Takes vote dumps in each state & plots ratios of Biden votes to Trump. Then draws three lines showing that if a data plot is above the line then it is in either the 95th percentile, 99th percentile, or 99.5th percentile. IOW, only one out of every two-hundred points are above it.
The study takes into account that large ballot dumps which heavily favor a candidate make sense, if there are also smaller ones which favor the candidate more. Seems logical. Larger data dumps should be smoother than smaller data dumps.
All states except MI/WI/GA are blue. Notice anything? Notice how the controversial and much needed dumps for Biden that happened in the wee hours of the morning in crucial states are the most unlikely of all data dumps?
Might say these were mail in ballots that were expected to heavily favor Biden. Why don't we see this in other states that weren't absolutely crucial to Biden's victory coming down the stretch? Why are these three states the most extreme? Why not heavy blue areas like NYC or SF?


i had an idea once to just write out all the conspiracies. still might do it. its so insane.
i have a lot of love for the obama mass hypnosis storyline.
im not making this shit up https://t.co/z9pBNWdGpn
goddamn this is the good stuff
ah yessssssssssssssssssssssss

these are all things republicans really said
— Oliver Willis (@owillis) October 29, 2020
democrats forced lenders to crash the housing market. george soros manipulated the markets too. this led to obama. obama used hypnosis to convince people to vote for him.
i have a lot of love for the obama mass hypnosis storyline.
im not making this shit up https://t.co/z9pBNWdGpn
goddamn this is the good stuff
ah yessssssssssssssssssssssss

And ‘audit’ can only be as good as the Auditor + Access that they are given + standards they are auditing to.
I feel like (when it comes to Tech) we have people making rules & certifications that can neither hear, nor see... evil.
Remember this as we call for election “Audits”.
I feel like (when it comes to Tech) we have people making rules & certifications that can neither hear, nor see... evil.
Remember this as we call for election “Audits”.
Now, if what you are suggesting is they should do a full audit of election software + machine security, that could be worthwhile.
— Double-Wide Dreaming\u2b50\ufe0f\u2b50\ufe0f\u2b50\ufe0f (@2xwide_dreaming) November 7, 2020
But these software packages have *never* been reviewed/oversight!

