If you are new to F&O, you can start with Vertical Spreads (Debit and Credit spreads) instead of buying options in Stocks and Indices.
Here are some ways how you can do it, when you can do it and the right position sizing for doing it... 🧵 (1/25)
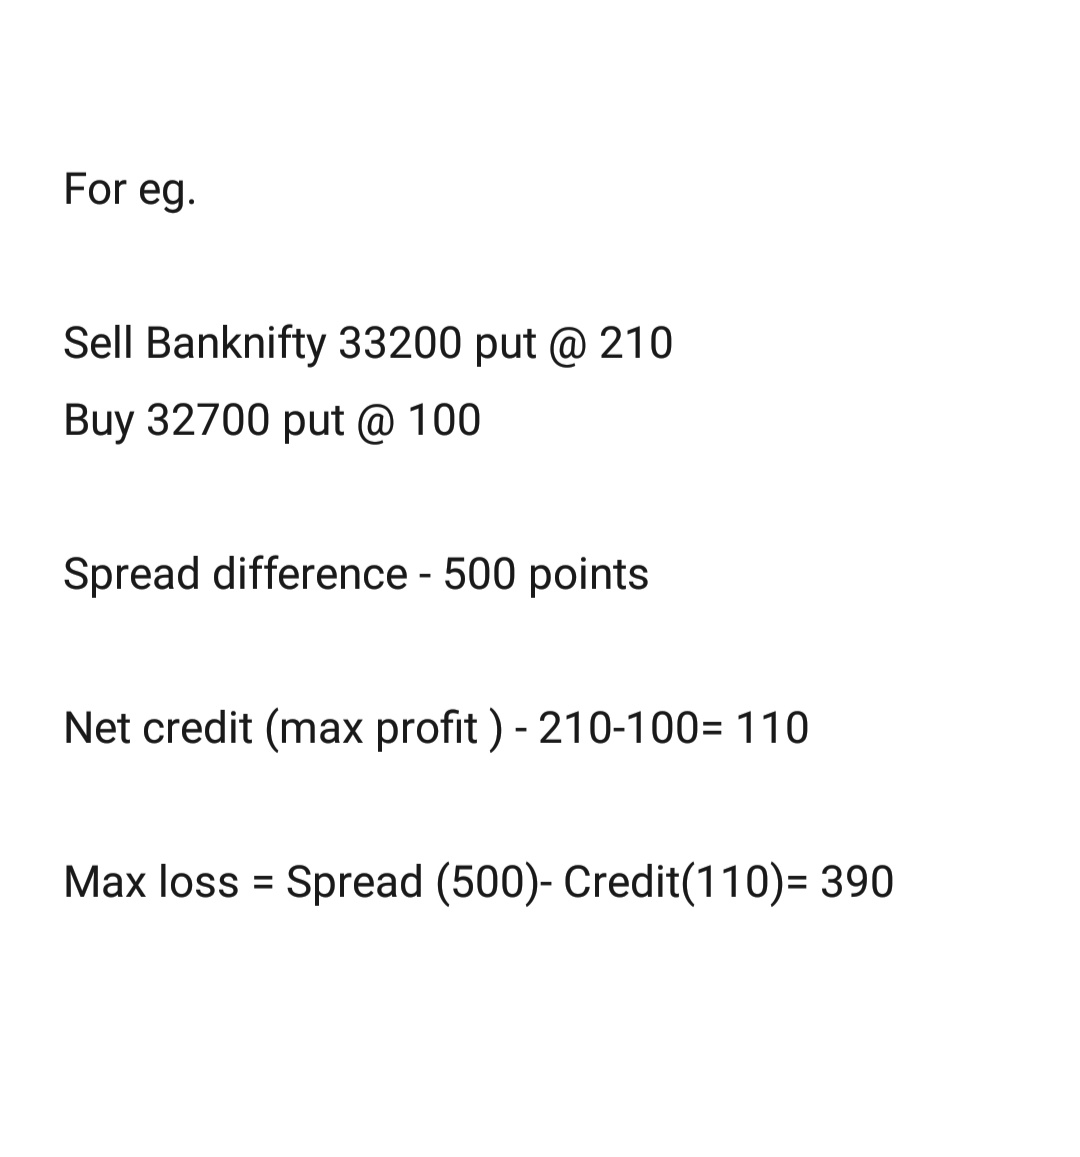
1. Bull call spread (Debit spread)
2. Bull put spread (Credit spread)
3. Bear call spread (Credit spread)
4. Bear put spread (Debit spread)
Read about these strategies in the below articles. (4/25)
While going through these strategies, you must have thought you have to wait till expiry for profits/loss. (5/25)
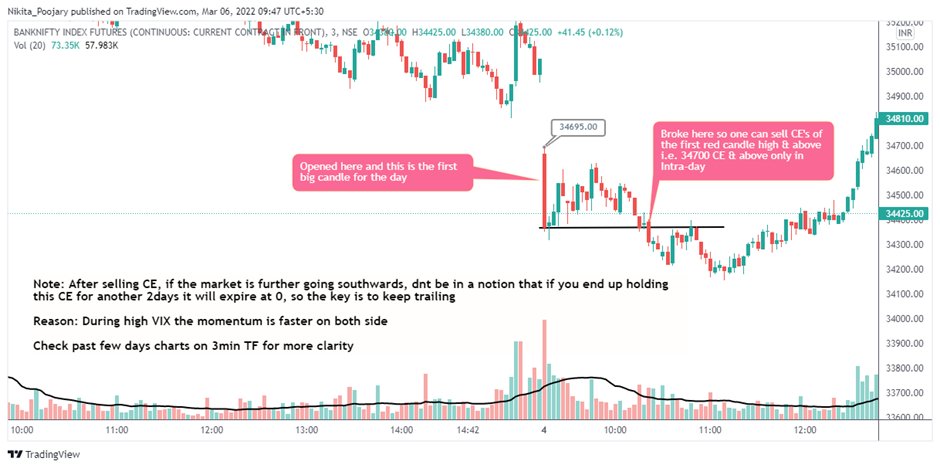
Let's understand how, when and what strategy to use with a few examples:
(you should have knowledge of price action for this) (7/25)
A recent example - since Oct 21 markets started falling, initially we assumed that it could be a pullback but many stocks started falling with good volumes, started making tops and giving false breakouts. (8/25)
In options, you got to be mindful of choosing stocks with good liquidity in options.(9/25)
When stocks/Index started rejecting from their major resistance areas.. mark that level. In reversal trades, you can trade via Credit Spread.
Sell ATM call and buy OTM call. (10/25)
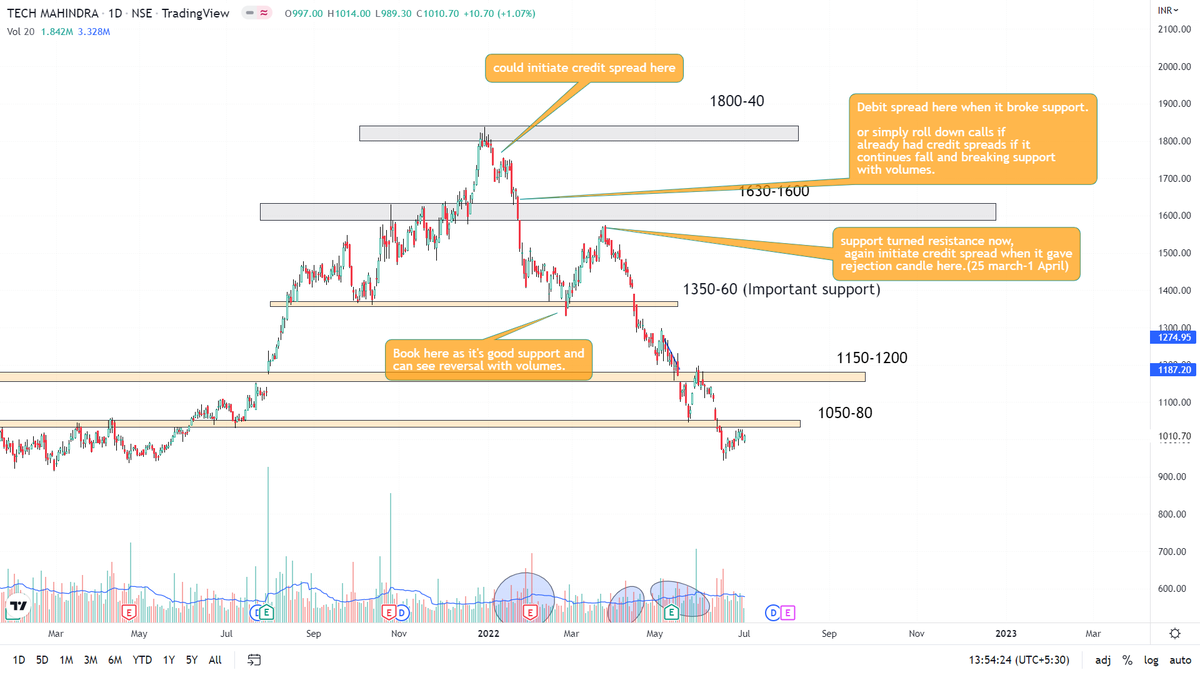
When any stock/Index breaks support and give a breakout, we can trade via Debit Spread as the move is fast in breakouts.
Buy ATM/ITM put and Sell OTM put
In TechM, we could buy 1650 put and sell 1550 put. (13/25)
Check the chart for reference. (14/25)
When you should initiate a trade?
First, you need to find out the major trend of instrument you are trading either Index or stocks.
At present, we know it's a bearish trend or sell on rise market.. (16/25)
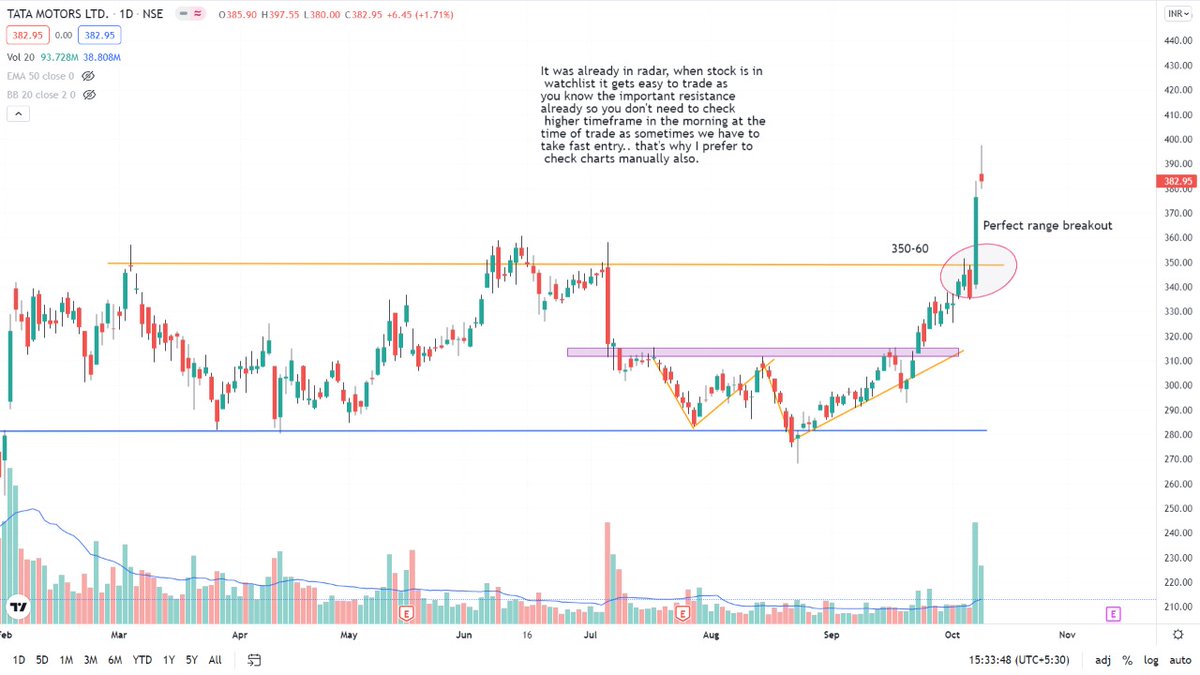
Every week you need to check the large cap stocks (if you are trading in stocks) and Index charts if you are trading Nifty/Banknifty. (17/25)
2. Check if it's near any resistance area
3. If it gave a rejection candle near imp. resistance (mark the level)
4. Or if it's breaking any imp. support
For entry, check the daily chart next day. (18/25)
Check the chart for your reference: (19/25)
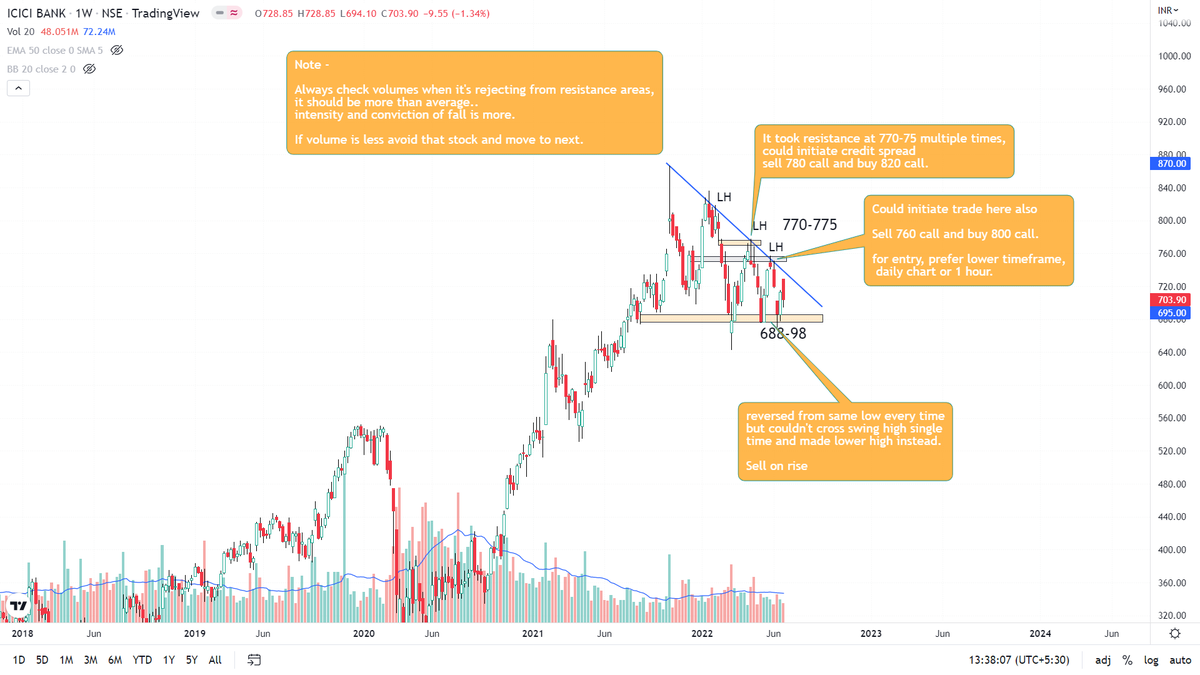
If stock/Index is near major support, don't sell call, as chances of reversal will be more from there. Even if it closes below resistance strike at expiry, in reversal, premiums will spike. You will see immediate loss which is tough to handle. (20/25)
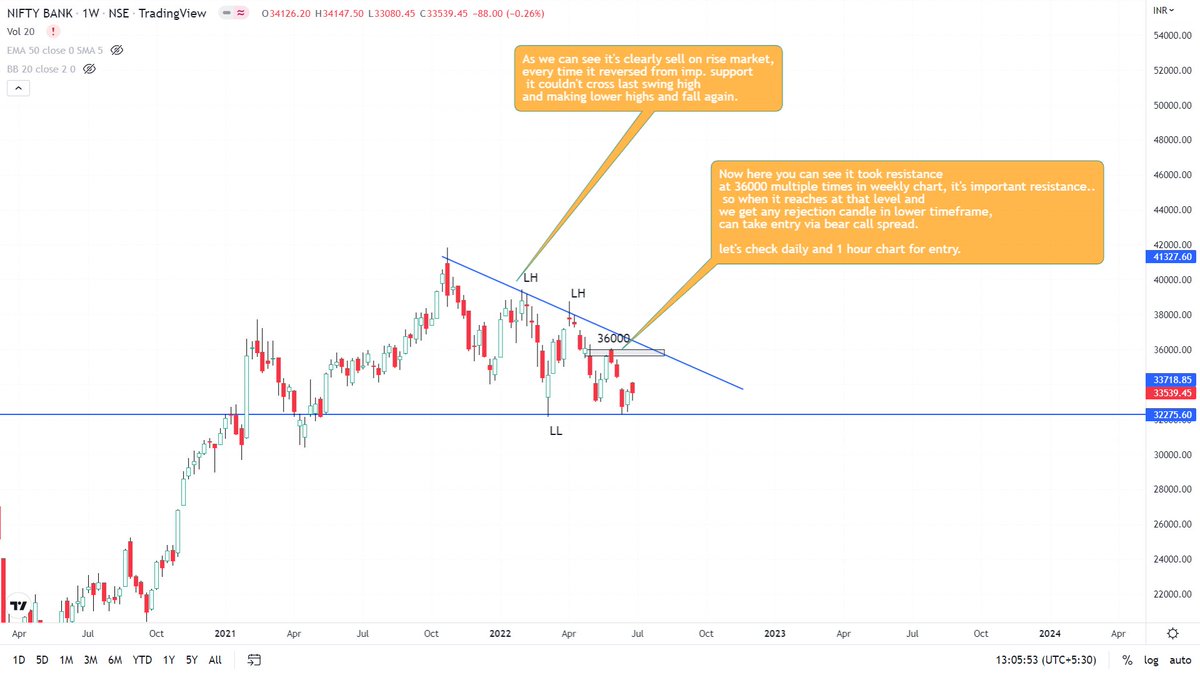
Let's check the charts of Nifty/Banknifty for trading weekly expiries(directional trading) via spreads: (21/25)
Vertical spreads are risk defined strategies. Keep sizing such that you don't lose over 3-4% in max loss or use 2L for 1 lot.
I think one should have at least 15L-20L for F&O.
In naked selling or in futures, the sizing should be fixed on notional exposure.(22/25)
Initially, you must not take more than 2x exposure.
Suppose the Notional value is 6L, you can take 1 lot using 3L or in simple language if you carry a naked selling option or futures, use 3-4L for one lot initially.. (23/25)
https://t.co/TVesQ0xnDe (24/25)
More from Sheetal Rijhwani

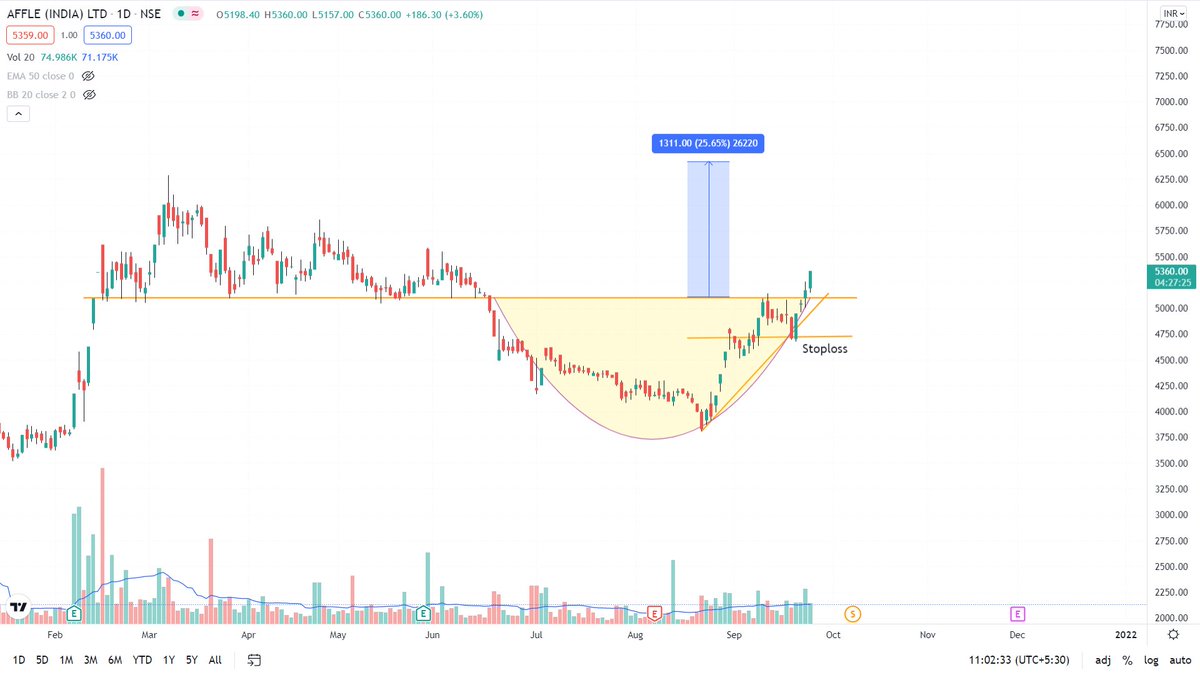
#AffleIndia updated chart
Target - 6400+
Stop loss - 4650 https://t.co/DD6pFtSvMI
Target - 6400+
Stop loss - 4650 https://t.co/DD6pFtSvMI
#AffleIndia
— Sheetal Rijhwani (@RijhwaniSheetal) August 8, 2021
It's at retest of weekly breakout level.. we can get a good entry with favourable risk/reward. Have a look at chart! #stockmarket #stockstowatch pic.twitter.com/cS9EOIoWJl
More from Optionslearnings


Tata Consumer too
There u have 30 now
Stick to these only !!!!
I keep getting msgs from ppl stuck in other stocks.
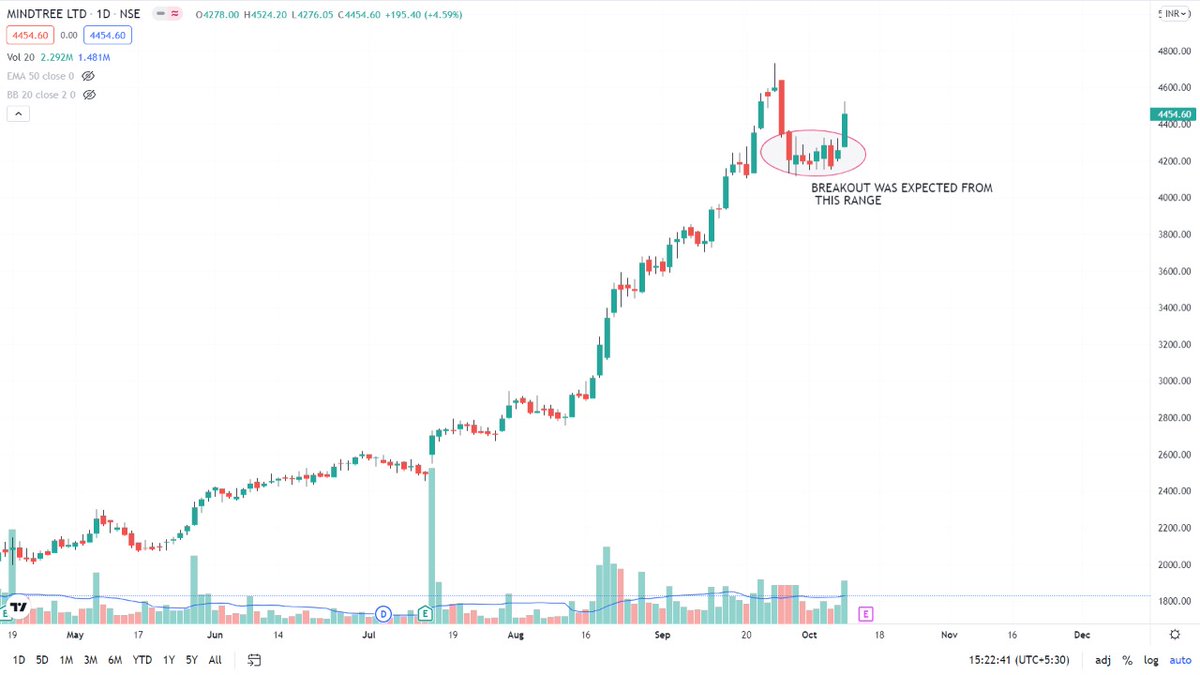
Just yday, someone asked abt Mindtree.
he shorted a CE and then when he wanted to cover,
the spread was 70 / 92 !!!
How many have faced such a problem?
Please add to this thread with actual examples
stock / strike price and rate
There u have 30 now
Stick to these only !!!!
HCLTECH
— Pathik (@Pathik_Trader) March 31, 2021
WIPRO
M&M
TITAN
Adding into list
Remove AUROPHARMA, BHARTIARTL, TAMO from list (personal hate\U0001f603\U0001f603)
I keep getting msgs from ppl stuck in other stocks.
Just yday, someone asked abt Mindtree.
he shorted a CE and then when he wanted to cover,
the spread was 70 / 92 !!!
How many have faced such a problem?
Please add to this thread with actual examples
stock / strike price and rate