
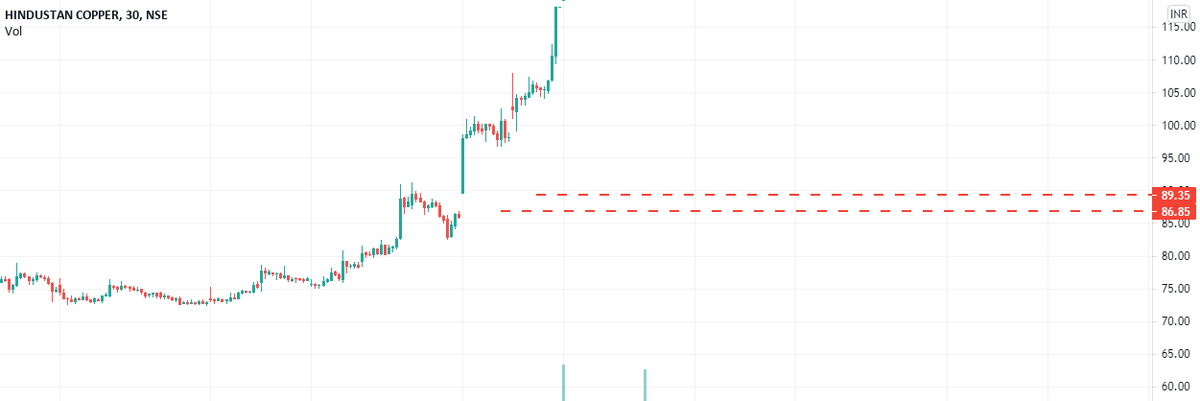
sir, hindcopper is having gap near 86-89, levels from February 19th,
copper is also showing gap at 645-650 levels, since 17th feb.
is it necessary that before going to all time high both the scrips fill the gap at lower levels.
recent gap in hindcopper is near137
More from Nishhcopper


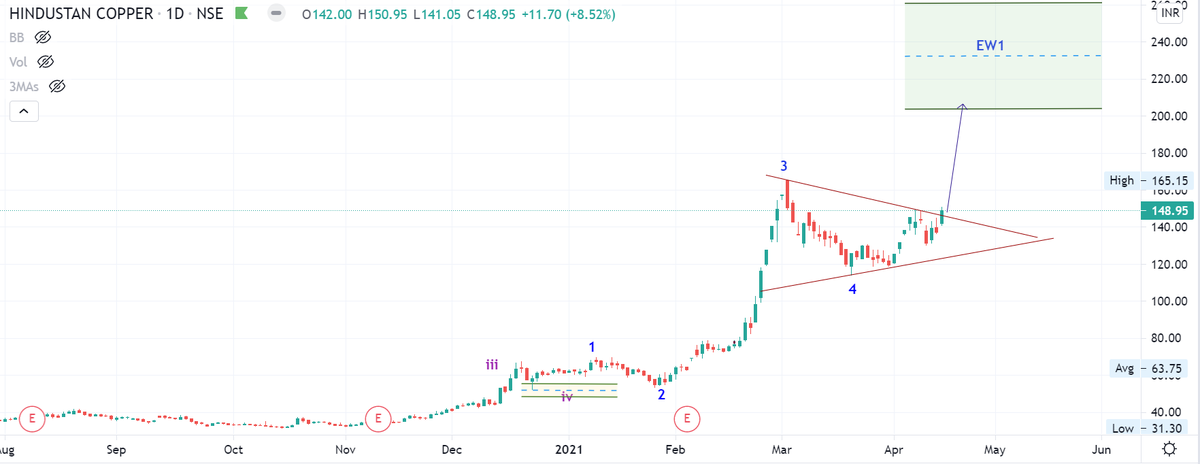
Hindustan copper - Another clean and simple chart!!
Whenever international prices shot up commodity stocks start soaring, previously it went up from 73 to 165!!
Now can it give move to 200/230+!!
Chart👇 https://t.co/1TJRP7rj0P
https://t.co/3An8uq0e3G
Whenever international prices shot up commodity stocks start soaring, previously it went up from 73 to 165!!
Now can it give move to 200/230+!!
Chart👇 https://t.co/1TJRP7rj0P
Good for Hindustan copper and Rain Industries!!
— Moneyspinners-Work 4UR Dreams (@Jai0409) January 18, 2021
Disc - Invested!! https://t.co/xfJKSWMeyw
https://t.co/3An8uq0e3G
Is copper leading the commodity supercycle? @Manisha3005 explains on #CommodityCorner https://t.co/nZ5FT4FsZ2
— CNBC-TV18 (@CNBCTV18News) April 16, 2021
You May Also Like


Neo-nazi group #PatriotFront held a photo op in #Chicago last weekend & is currently marching around #DC so it's as good time as any to compile a list of their identified members for folks to watch for
Who are these chuds?
Patriot Front broke away from white nationalist org Vanguard America following #unitetheright in #charlottesville after James Alex Fields was seen with a VA shield before driving his car into a crowd, murdering Heather Heyer & injuring dozens of others
Syed Robbie Javid a.k.a. Sayed Robbie Javid or Robbie Javid of Alexandria,
Antoine Bernard Renard (a.k.a. “Charlemagne MD” on Discord) from Rockville, MD.
https://t.co/ykEjdZFDi6

Brandon Troy Higgs, 25, from Reisterstown,
Who are these chuds?
Patriot Front broke away from white nationalist org Vanguard America following #unitetheright in #charlottesville after James Alex Fields was seen with a VA shield before driving his car into a crowd, murdering Heather Heyer & injuring dozens of others
Syed Robbie Javid a.k.a. Sayed Robbie Javid or Robbie Javid of Alexandria,
Happy Monday everyone :-) Let's ring in September by reacquainting ourselves with Virginia neo-Nazi and NSC Dixie affiliate Sayed "Robbie" Javid, now known by "Reform the States". Robbie is an explicitly genocidal neo-Nazi, so lets get to know him a bit better!
— Garfield but Anti-Fascist (@AntifaGarfield) August 31, 2020
CW on this thread pic.twitter.com/3gzxrIo9HD
Antoine Bernard Renard (a.k.a. “Charlemagne MD” on Discord) from Rockville, MD.
https://t.co/ykEjdZFDi6
Brandon Troy Higgs, 25, from Reisterstown,


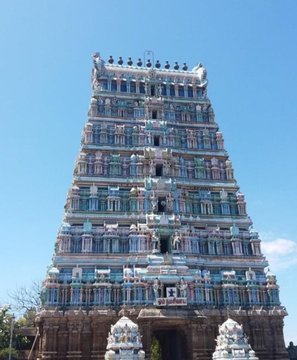
Margatha Natarajar murthi - Uthirakosamangai temple near Ramanathapuram,TN
#ArudraDarisanam
Unique Natarajar made of emerlad is abt 6 feet tall.
It is always covered with sandal paste.Only on Thriuvadhirai Star in month Margazhi-Nataraja can be worshipped without sandal paste.
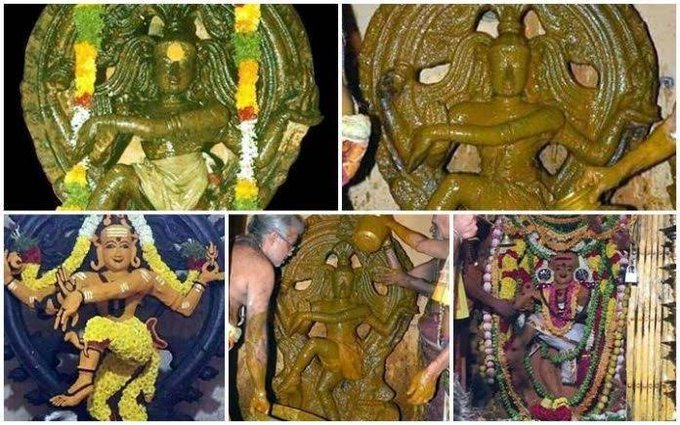
After removing the sandal paste,day long rituals & various abhishekam will be https://t.co/e1Ye8DrNWb day Maragatha Nataraja sannandhi will be closed after anointing the murthi with fresh sandal paste.Maragatha Natarajar is covered with sandal paste throughout the year
as Emerald has scientific property of its molecules getting disturbed when exposed to light/water/sound.This is an ancient Shiva temple considered to be 3000 years old -believed to be where Bhagwan Shiva gave Veda gyaana to Parvati Devi.This temple has some stunning sculptures.
#ArudraDarisanam
Unique Natarajar made of emerlad is abt 6 feet tall.
It is always covered with sandal paste.Only on Thriuvadhirai Star in month Margazhi-Nataraja can be worshipped without sandal paste.
After removing the sandal paste,day long rituals & various abhishekam will be https://t.co/e1Ye8DrNWb day Maragatha Nataraja sannandhi will be closed after anointing the murthi with fresh sandal paste.Maragatha Natarajar is covered with sandal paste throughout the year
as Emerald has scientific property of its molecules getting disturbed when exposed to light/water/sound.This is an ancient Shiva temple considered to be 3000 years old -believed to be where Bhagwan Shiva gave Veda gyaana to Parvati Devi.This temple has some stunning sculptures.
