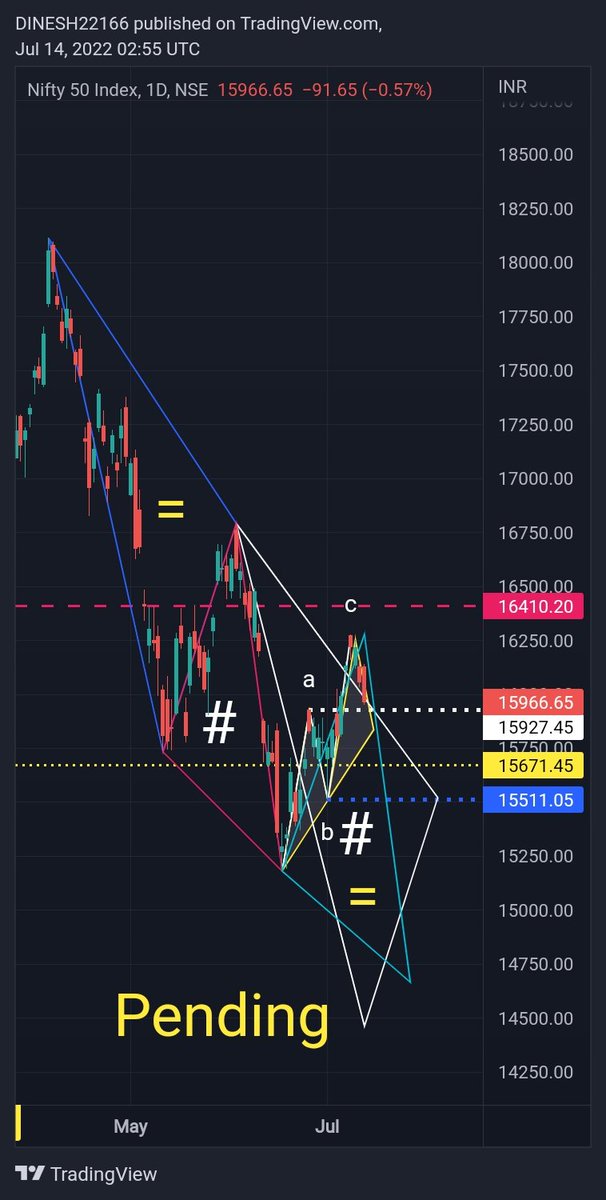
#NiFTY_50(15966.65)
#Hold short.... Continue...as per weekly view.
Daily chart.
Pending means target near to Fibonacci retracement level 0.382% (14366).
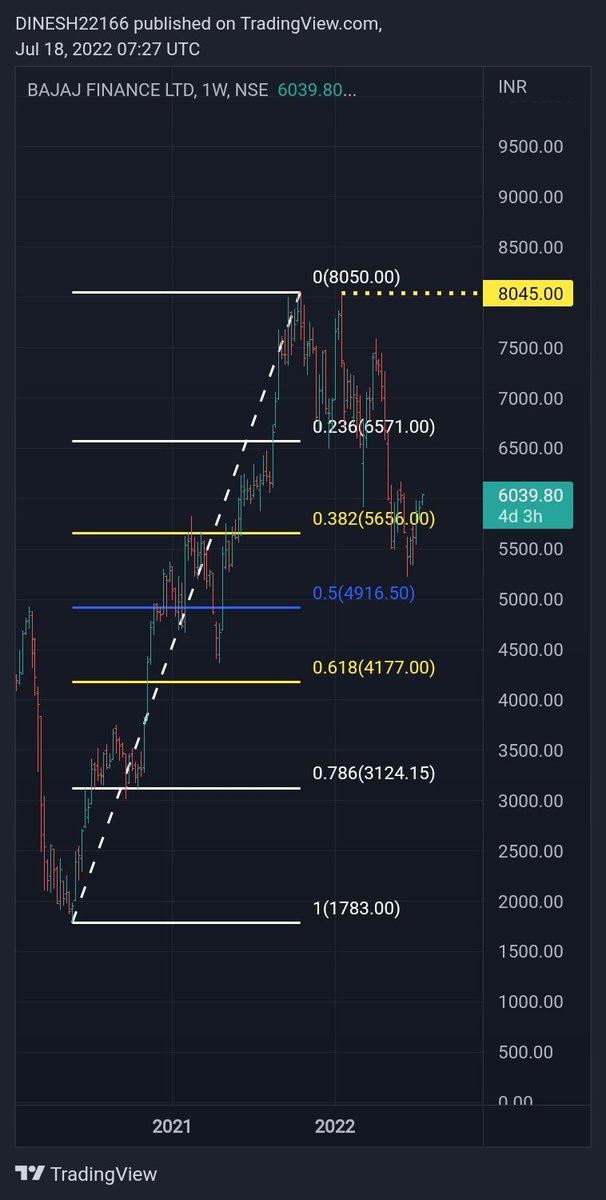
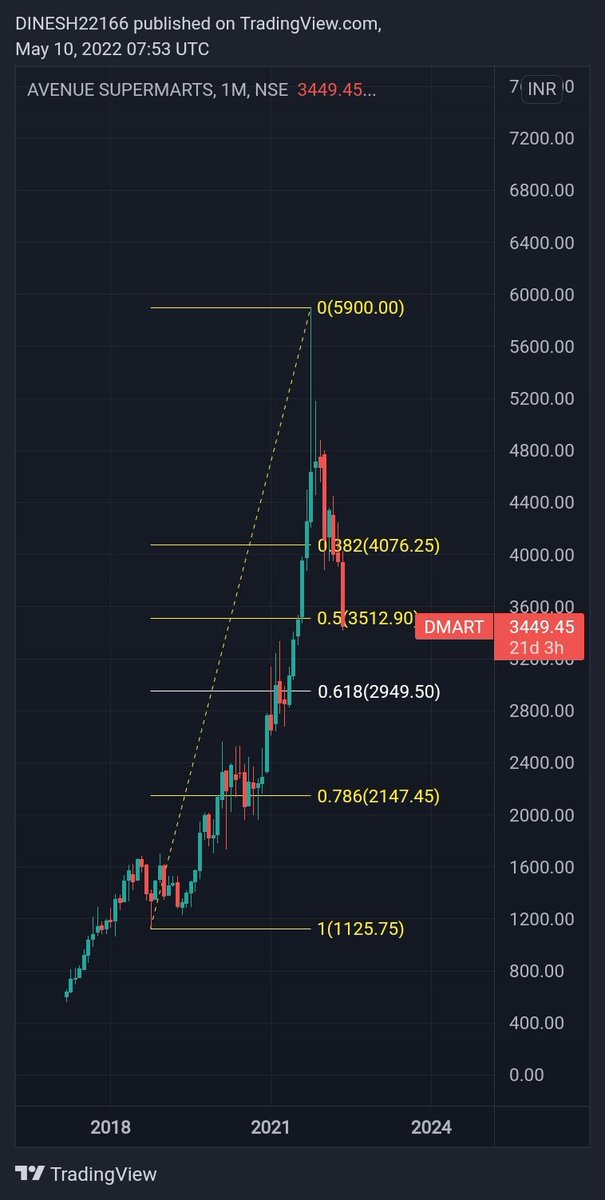
Weekly chart for Fibonacci retracement level.
#Perception
More from Waves_Perception(Dinesh Patel) मैंSchedule Tribe)
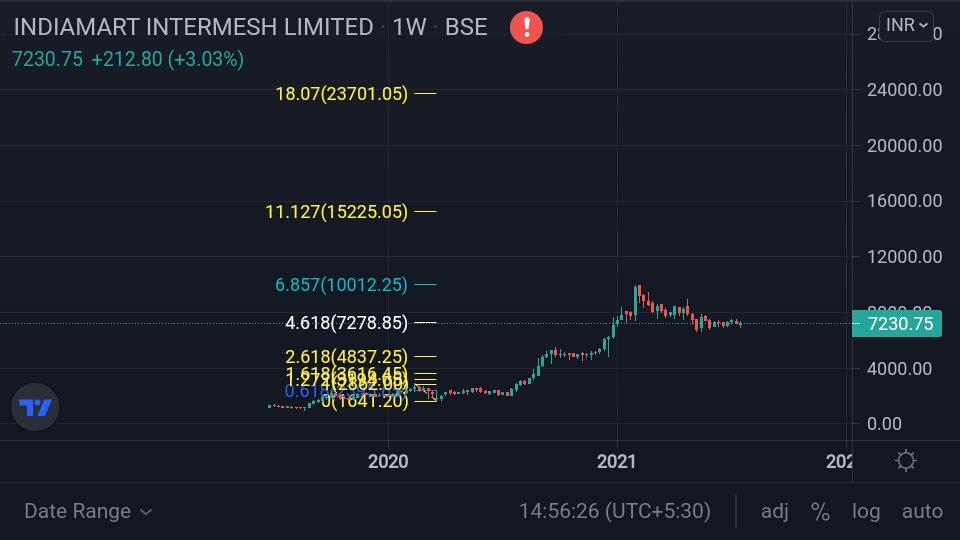
#LTI -4614
Probability towards 4.618% and beyond..
#Possibility
Probability towards 4.618% and beyond..
#Possibility
#LTI -4145
— MaRkET WaVES (DINESH PATEL ) Stock Market FARMER (@idineshptl) July 14, 2021
Near term base Case (4024)
Look for 4.618% and 6.857%
Long term perspective Fibonacci extension shown in chart. #Perspective pic.twitter.com/Pyl0aGYIuS
More from Niftylongterm

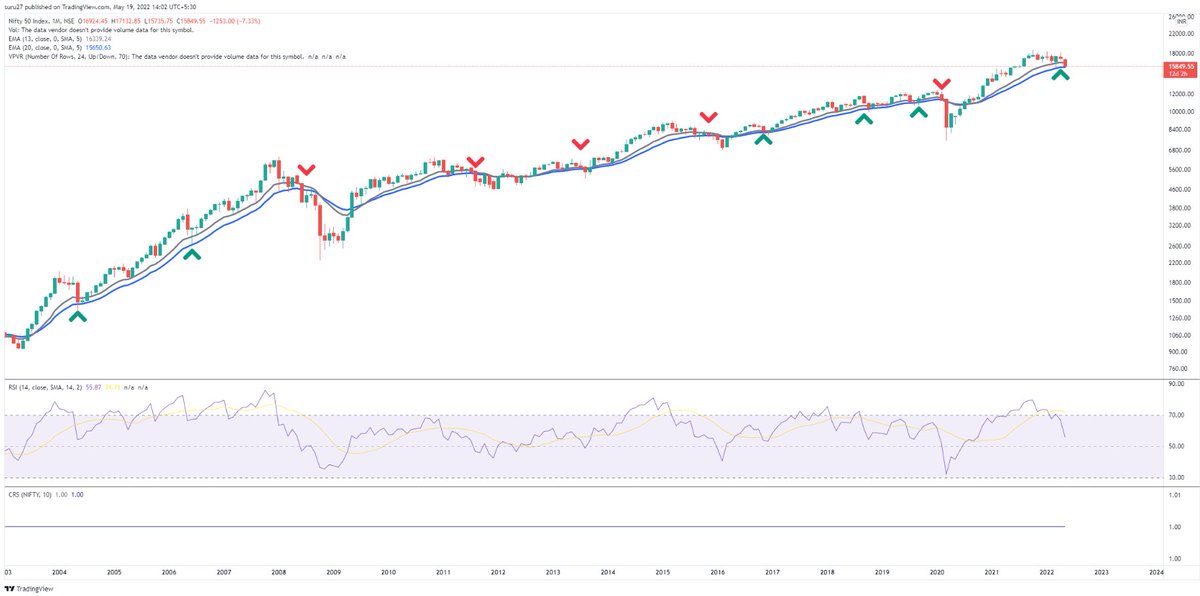
#NIFTY
15 Months to this post. No change in the larger projections.
15 Months to this post. No change in the larger projections.
Long Term Chart of the Year.#NIFTY - Wave 5 (Cycle Degree) Target Zone of 25000-34000 by 2024-2027.
— Piyush Chaudhry (@piyushchaudhry) December 19, 2020
Reassessment on a breach below Blue Trendline. A breach is not a necessary invalidation. Depends on internals.
The dashed path is for representative purpose only. #ElliottWave pic.twitter.com/1xVY4OSr5T