
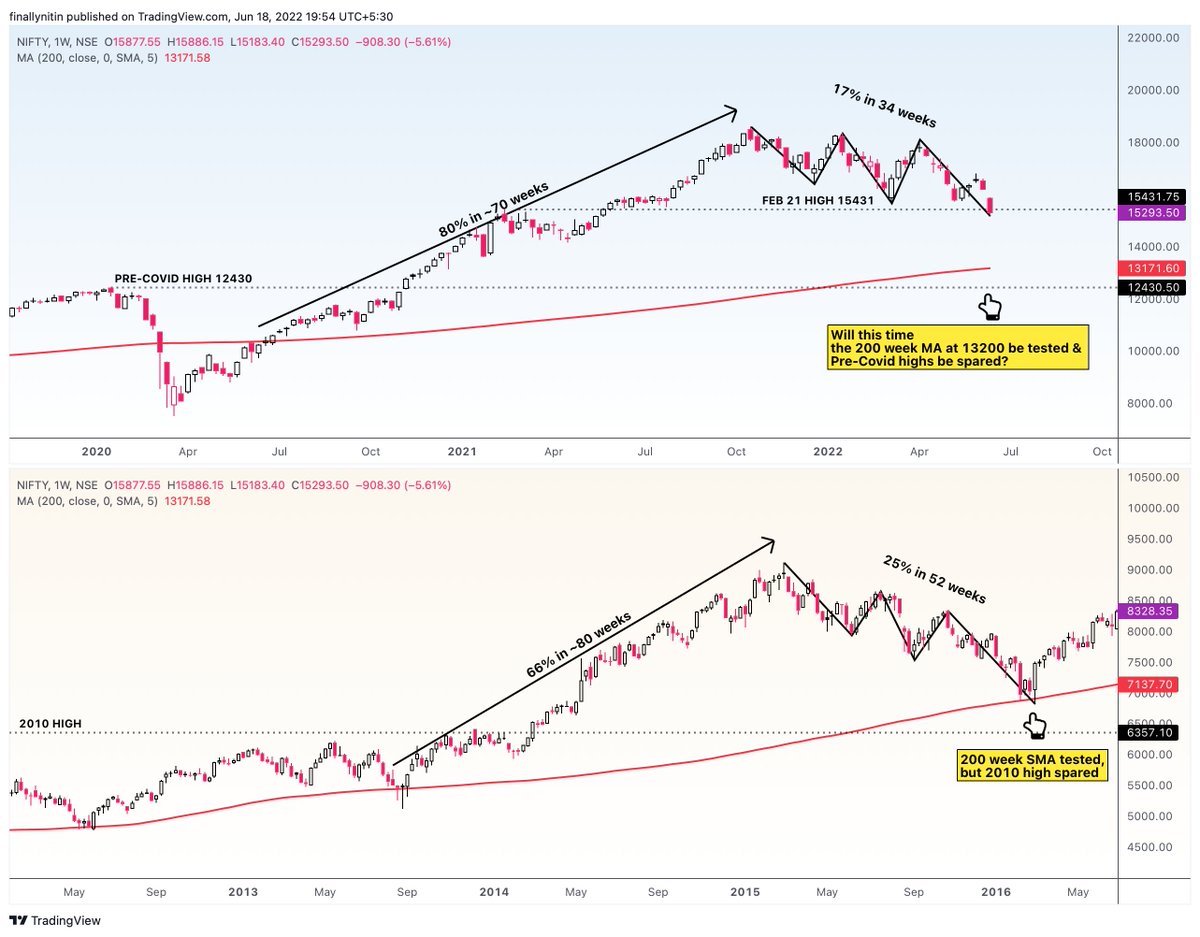
#NIFTY weekly chart showing some similarities with the 2015-16 fall.
Both falls were preceded by an almost non-stop bull run for 1-2 years (counting from last retest of 200-week SMA).
In 2015-16, index fell 25% in 52 weeks. So far, from Oct 21, we have fallen 17% in 34 weeks.
More from Nitin R


More from Niftylongterm


Well, alarms were sound.
₹Nifty > #Nifty
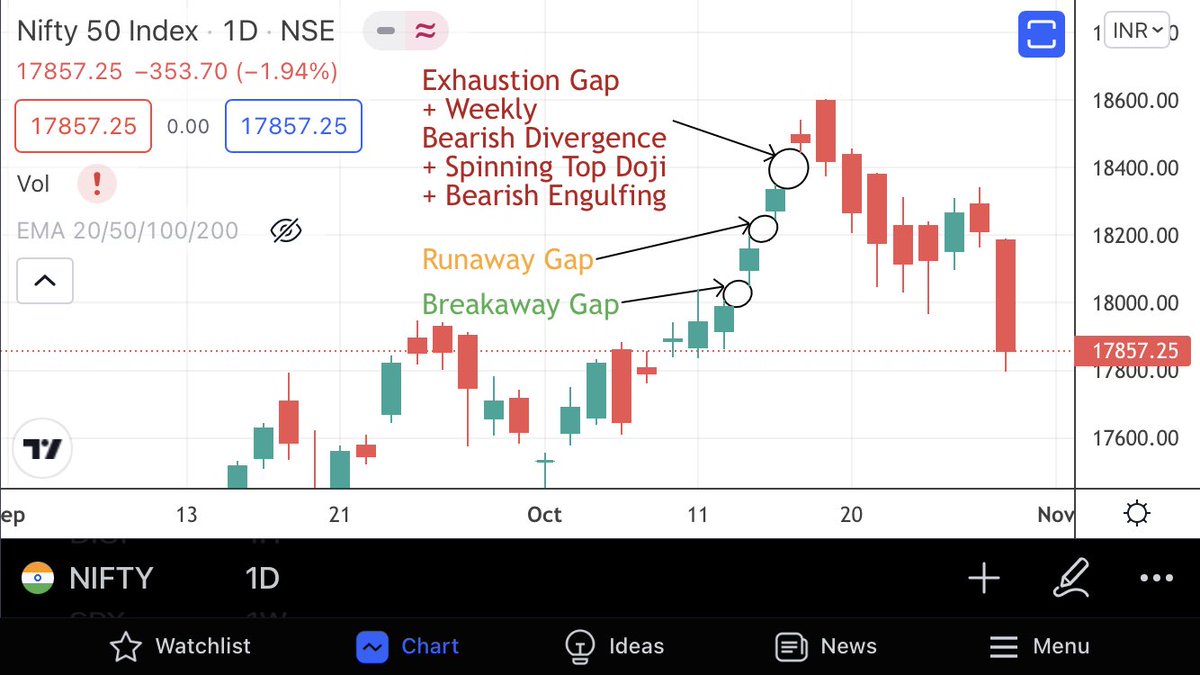
Explanation for the alarm that sounded. Textbook short term top.
Clean technicals.
₹Nifty > #Nifty
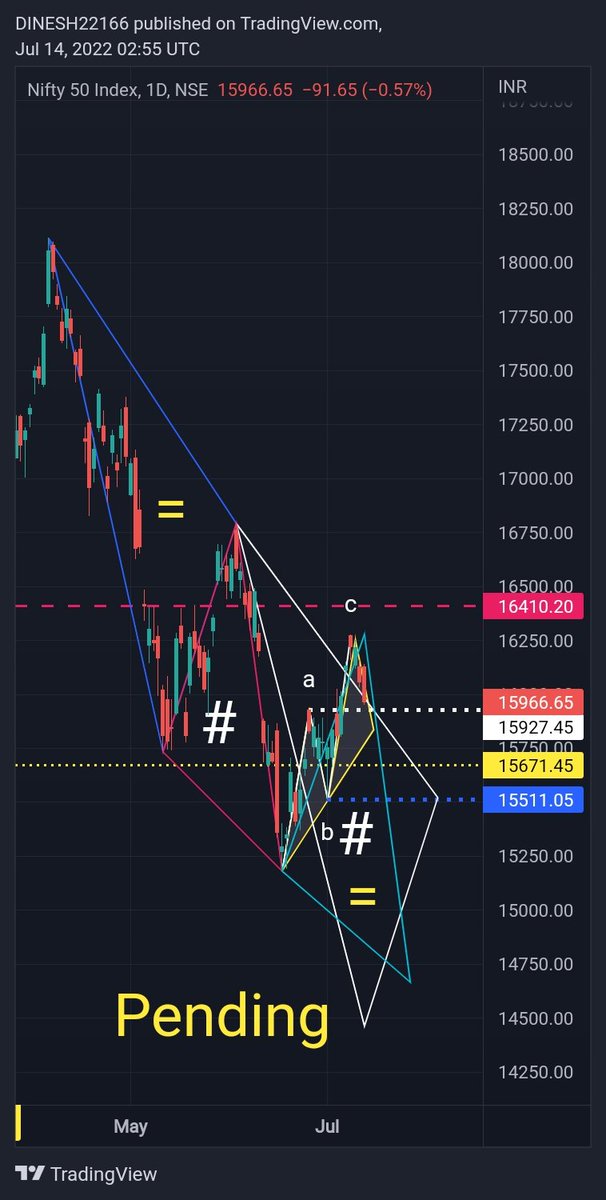
Is Nifty gunning for an ultimate double zig-zag shake out towards 17k which would coincide with weekly 20 EMA and 100 DEMA tag? Fair possibility. Only time will tell. Watch for the break of 50 DEMA and support zone.
₹Nifty > #Nifty
@piyushchaudhry
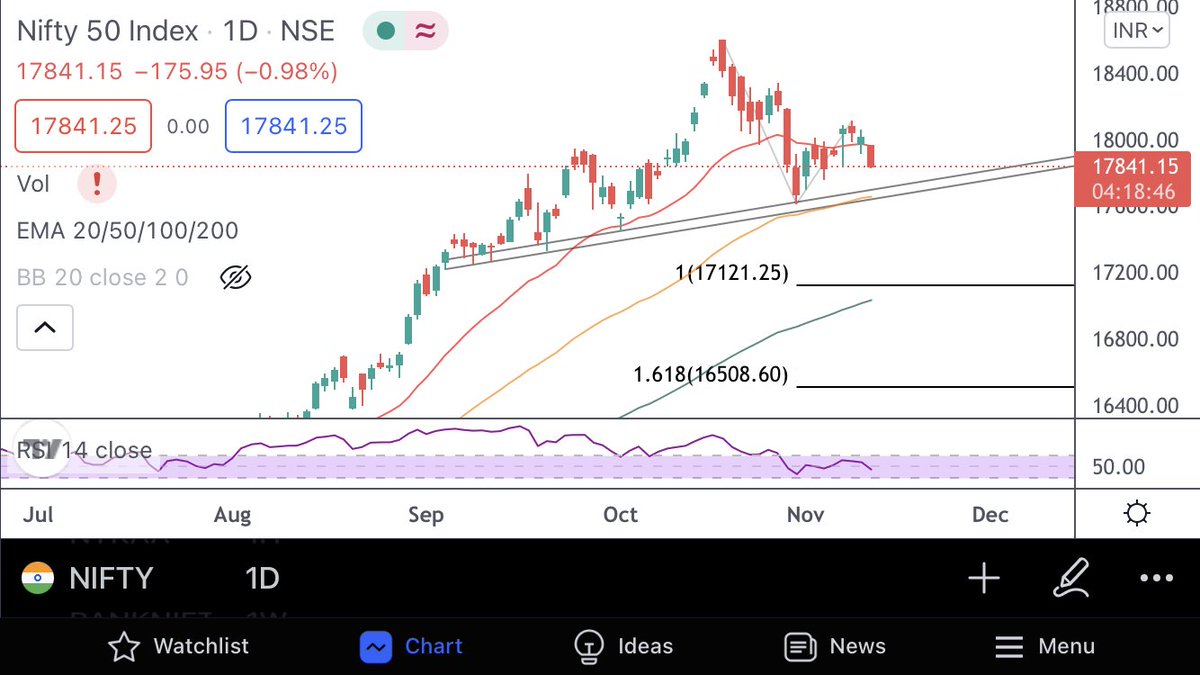
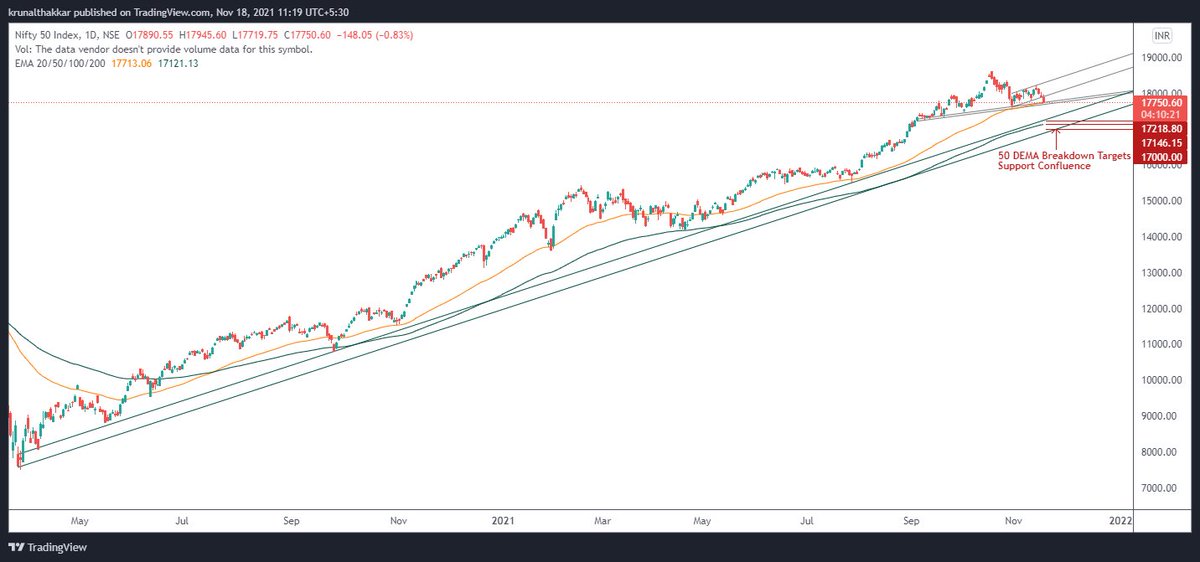
If Nifty breaks 50 DEMA and closes below 17700. 17220-17150-17000 possible. Worst case scenario is ~17000. Lot of confluence support in that range.
Do your DD.
₹Nifty > #Nifty
Nifty’s daily looks like ABC is done, but internals suggests that it still needs a final sell off to make a bottom for WXY. A bull trap towards 17735-17810 can’t be ruled out before the final sell off.
Just analysis, reserve the right to be wrong.
₹Nifty > #Nifty
₹Nifty > #Nifty
Tight Bearish divergence on Nifty Weekly. Ready to snap back to Weekly 20 EMA? Current Weekly 20 EMA at 16864. Stay Cautious!
— Krunal Thakkar (@KrunallThakkar) October 22, 2021
\u20b9Nifty > #Nifty
Explanation for the alarm that sounded. Textbook short term top.
Clean technicals.
₹Nifty > #Nifty
Is Nifty gunning for an ultimate double zig-zag shake out towards 17k which would coincide with weekly 20 EMA and 100 DEMA tag? Fair possibility. Only time will tell. Watch for the break of 50 DEMA and support zone.
₹Nifty > #Nifty
@piyushchaudhry
If Nifty breaks 50 DEMA and closes below 17700. 17220-17150-17000 possible. Worst case scenario is ~17000. Lot of confluence support in that range.
Do your DD.
₹Nifty > #Nifty
Nifty’s daily looks like ABC is done, but internals suggests that it still needs a final sell off to make a bottom for WXY. A bull trap towards 17735-17810 can’t be ruled out before the final sell off.
Just analysis, reserve the right to be wrong.
₹Nifty > #Nifty

#NIFTY
15 Months to this post. No change in the larger projections.
15 Months to this post. No change in the larger projections.
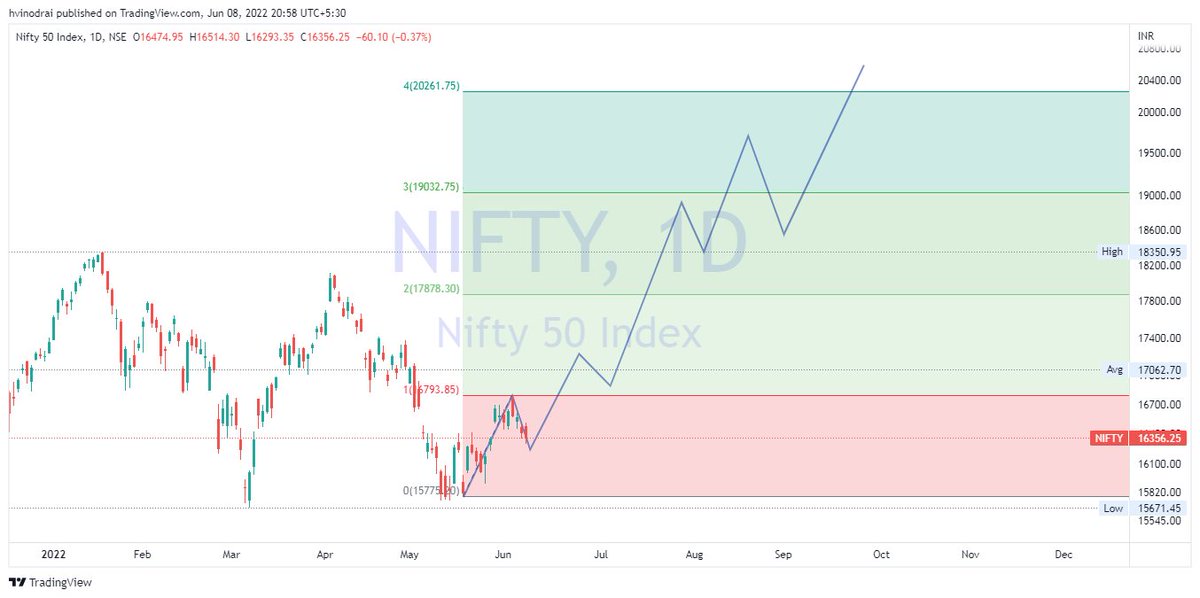
Long Term Chart of the Year.#NIFTY - Wave 5 (Cycle Degree) Target Zone of 25000-34000 by 2024-2027.
— Piyush Chaudhry (@piyushchaudhry) December 19, 2020
Reassessment on a breach below Blue Trendline. A breach is not a necessary invalidation. Depends on internals.
The dashed path is for representative purpose only. #ElliottWave pic.twitter.com/1xVY4OSr5T
You May Also Like


Oh my Goodness!!!
I might have a panic attack due to excitement!!
Read this thread to the end...I just had an epiphany and my mind is blown. Actually, more than blown. More like OBLITERATED! This is the thing! This is the thing that will blow the entire thing out of the water!
Has this man been concealing his true identity?
Is this man a supposed 'dead' Seal Team Six soldier?
Witness protection to be kept safe until the right moment when all will be revealed?!
Who ELSE is alive that may have faked their death/gone into witness protection?

Were "golden tickets" inside the envelopes??

Are these "golden tickets" going to lead to their ultimate undoing?
Review crumbs on the board re: 'gold'.

#SEALTeam6 Trump re-tweeted this.

I might have a panic attack due to excitement!!
Read this thread to the end...I just had an epiphany and my mind is blown. Actually, more than blown. More like OBLITERATED! This is the thing! This is the thing that will blow the entire thing out of the water!
Tik Tok pic.twitter.com/8X3oMxvncP
— Scotty Mar10 (@Allenma15086871) December 29, 2020
Has this man been concealing his true identity?
Is this man a supposed 'dead' Seal Team Six soldier?
Witness protection to be kept safe until the right moment when all will be revealed?!
Who ELSE is alive that may have faked their death/gone into witness protection?
Were "golden tickets" inside the envelopes??
Are these "golden tickets" going to lead to their ultimate undoing?
Review crumbs on the board re: 'gold'.
#SEALTeam6 Trump re-tweeted this.