
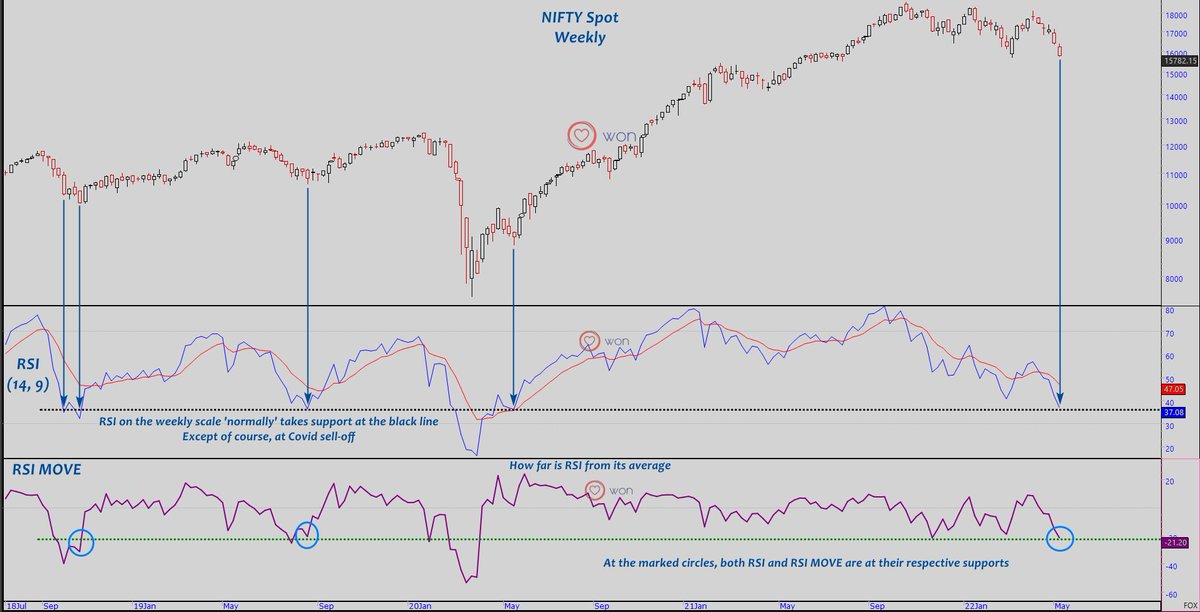
#NIFTY in the context of #RSI #Weekly Timeframe
RSI with default values of 14,9
RSI MOVE measures the deviation of RSI from its average
IMHO, it is an excellent time to buy and accumulate #NiftyBees
Retweet if you find it useful 🙏🏽
More from Niftylongterm


#NIFTY
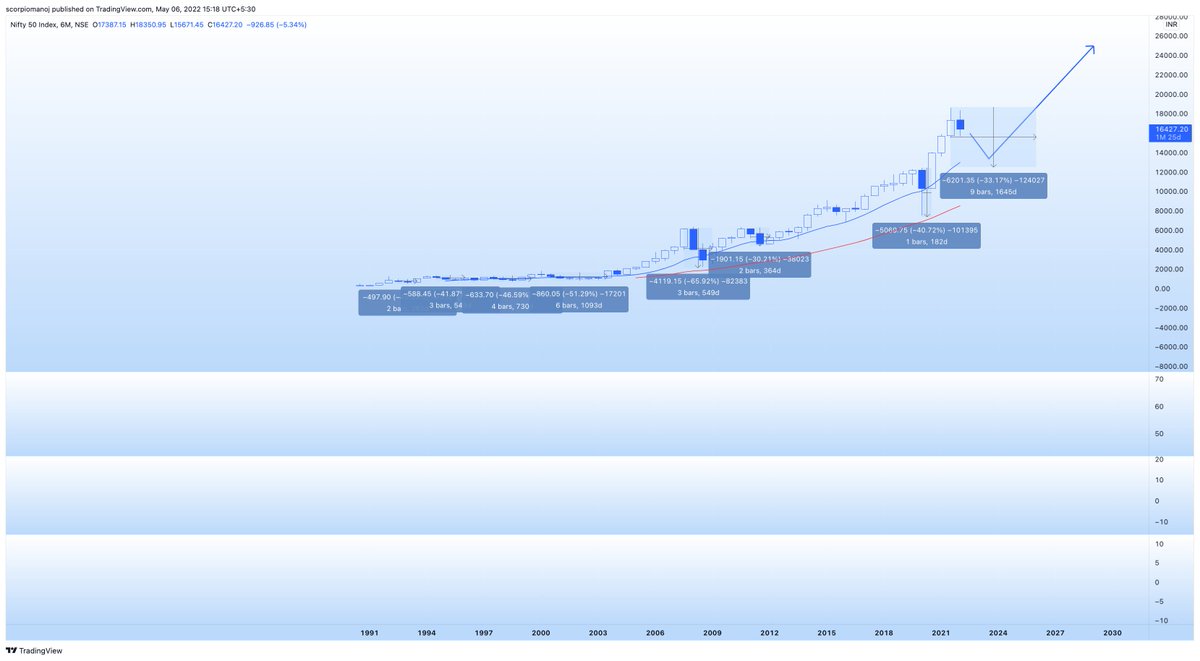
15 Months to this post. No change in the larger projections.
15 Months to this post. No change in the larger projections.
Long Term Chart of the Year.#NIFTY - Wave 5 (Cycle Degree) Target Zone of 25000-34000 by 2024-2027.
— Piyush Chaudhry (@piyushchaudhry) December 19, 2020
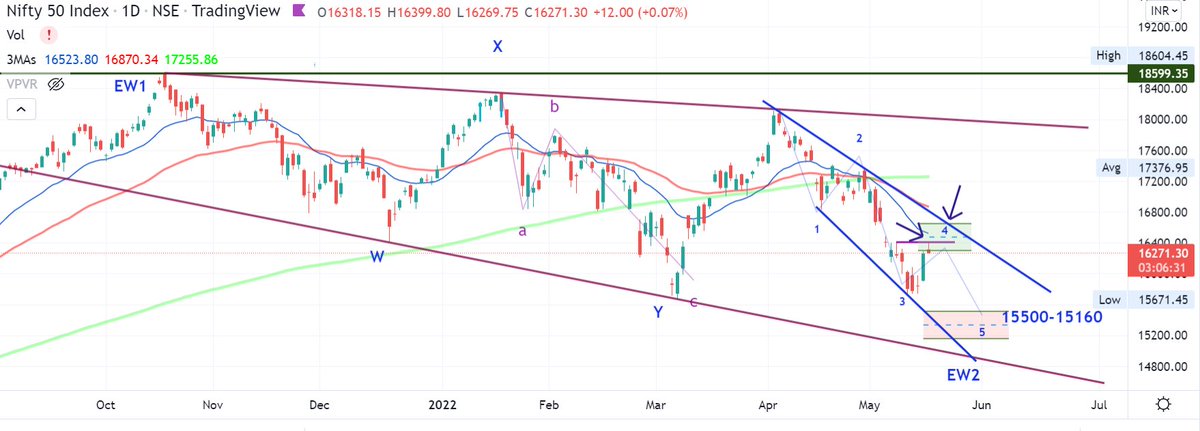
Reassessment on a breach below Blue Trendline. A breach is not a necessary invalidation. Depends on internals.
The dashed path is for representative purpose only. #ElliottWave pic.twitter.com/1xVY4OSr5T


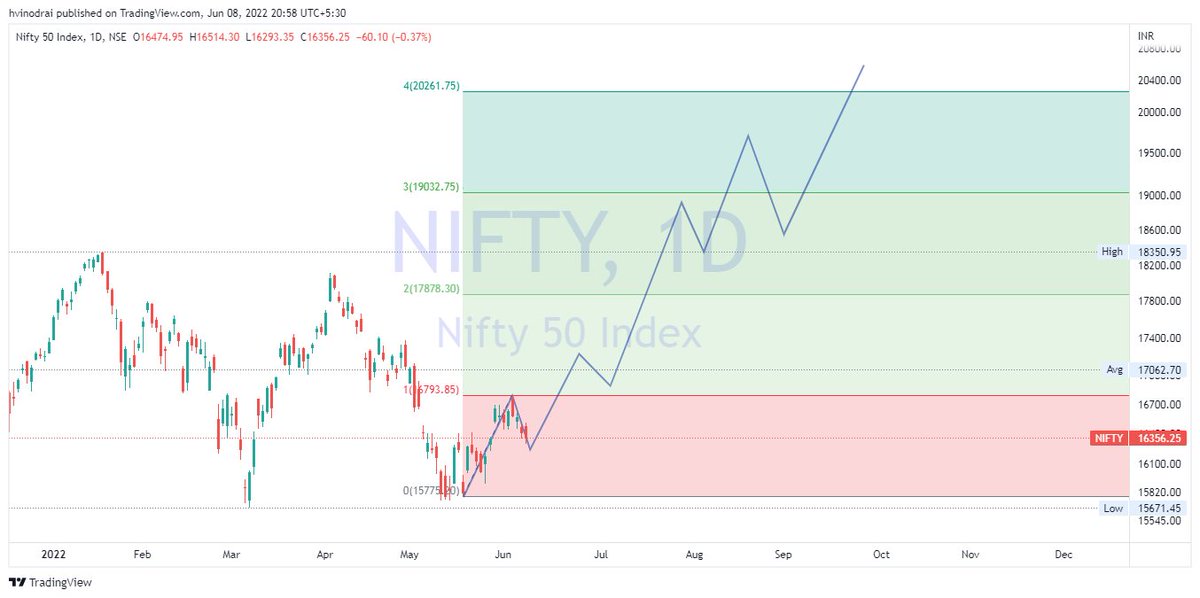
Nifty 50-Until 16600 is crossed then there is every chance of one more leg downwards (Wave5)
If it closes below 15700 then we can see 15500/15160
5th wave-can get truncated,
Get rid of kachra!!
Good opportunity to accumulate quality companies
chart👇
cheers https://t.co/b0M5QRcq7e
If it closes below 15700 then we can see 15500/15160
5th wave-can get truncated,
Get rid of kachra!!
Good opportunity to accumulate quality companies
chart👇
cheers https://t.co/b0M5QRcq7e
Please use the opportunity to move out of the low-quality companies into high-quality companies.
— Moneyspinners - Work Hard, Dream Big!! (@Jai0409) May 18, 2022
You May Also Like


Nano Course On Python For Trading
==========================
Module 1
Python makes it very easy to analyze and visualize time series data when you’re a beginner. It's easier when you don't have to install python on your PC (that's why it's a nano course, you'll learn python...
... on the go). You will not be required to install python in your PC but you will be using an amazing python editor, Google Colab Visit https://t.co/EZt0agsdlV
This course is for anyone out there who is confused, frustrated, and just wants this python/finance thing to work!
In Module 1 of this Nano course, we will learn about :
# Using Google Colab
# Importing libraries
# Making a Random Time Series of Black Field Research Stock (fictional)
# Using Google Colab
Intro link is here on YT: https://t.co/MqMSDBaQri
Create a new Notebook at https://t.co/EZt0agsdlV and name it AnythingOfYourChoice.ipynb
You got your notebook ready and now the game is on!
You can add code in these cells and add as many cells as you want
# Importing Libraries
Imports are pretty standard, with a few exceptions.
For the most part, you can import your libraries by running the import.
Type this in the first cell you see. You need not worry about what each of these does, we will understand it later.