More from Jubliantingrevia
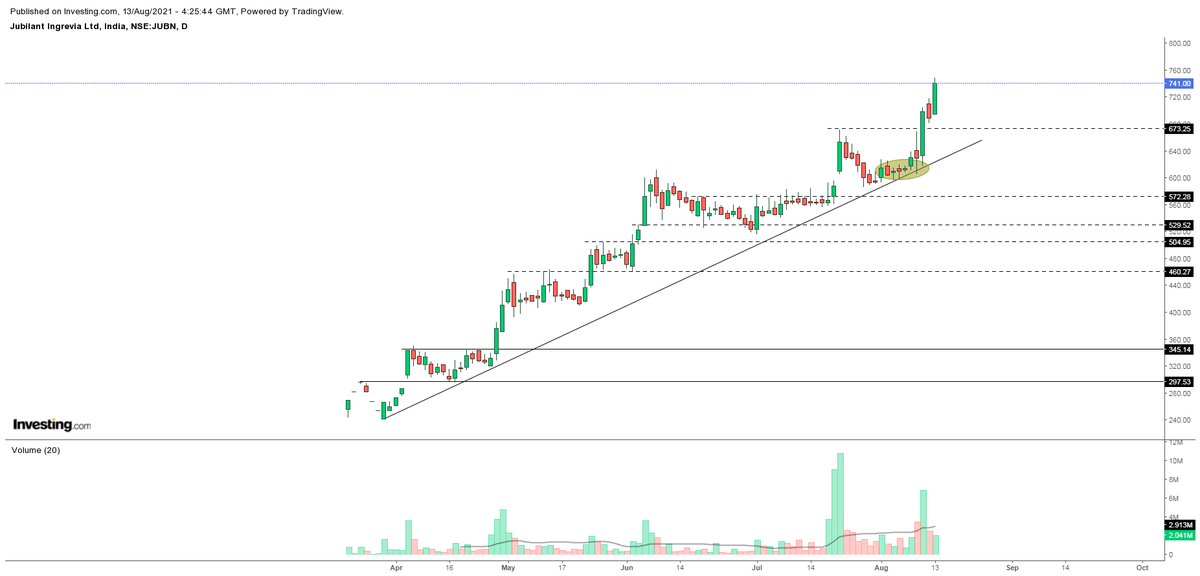
#JUBILANT INGREVIA LTD
Any dip till 740 seems a buying opportunity.
Post Q2 it may give decent up move.
#INVESTING https://t.co/gyyuivs0tT
Any dip till 740 seems a buying opportunity.
Post Q2 it may give decent up move.
#INVESTING https://t.co/gyyuivs0tT

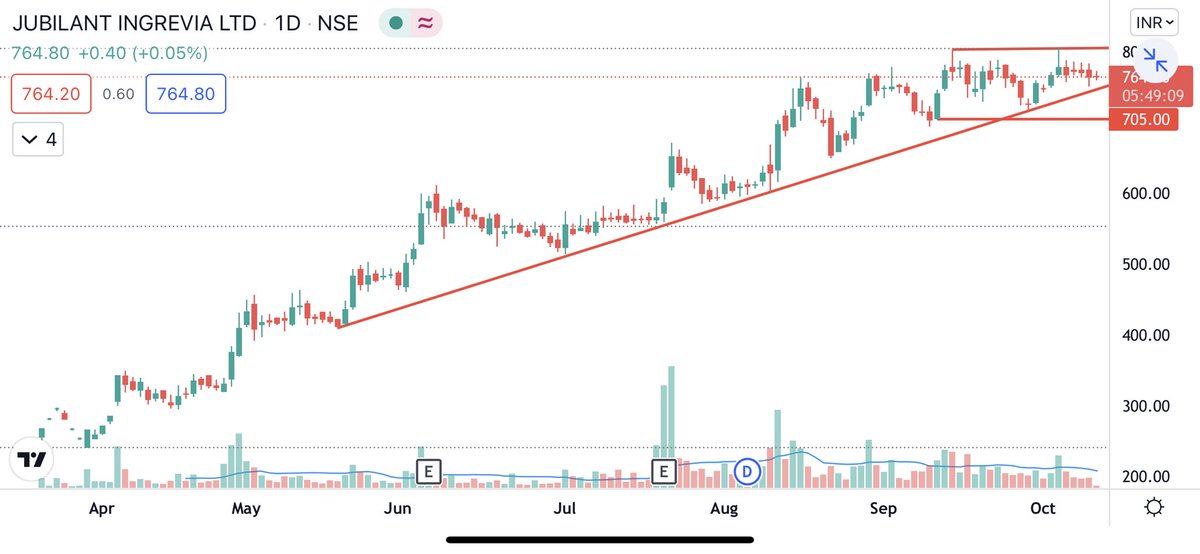
Ideally this should cross four digit in mid term if they maintain similar growth
— JAKERA CHOUDHURY (@Jakerachoudhury) July 22, 2021
Happy that you are making profit in this. Kudos#jubilant ingrevia https://t.co/le7f6bSjuz
Jubilant Ingrevia - I always look for bullish candlesticks at major support/resistance points. Here is a beautiful bullish Morning star right at the trendline support after a brief selling for three days. https://t.co/feSXlVhoya

Also on my radar for today:
— The_Chartist \U0001f4c8 (@nison_steve) July 29, 2021
1. ACE (Entry already done & SL is 230)
2. Jubilant Ingrevia (SL 550) - stock re-tested support pic.twitter.com/3S9UdDhhHL
You May Also Like
Nano Course On Python For Trading
==========================
Module 1
Python makes it very easy to analyze and visualize time series data when you’re a beginner. It's easier when you don't have to install python on your PC (that's why it's a nano course, you'll learn python...
... on the go). You will not be required to install python in your PC but you will be using an amazing python editor, Google Colab Visit https://t.co/EZt0agsdlV
This course is for anyone out there who is confused, frustrated, and just wants this python/finance thing to work!
In Module 1 of this Nano course, we will learn about :
# Using Google Colab
# Importing libraries
# Making a Random Time Series of Black Field Research Stock (fictional)
# Using Google Colab
Intro link is here on YT: https://t.co/MqMSDBaQri
Create a new Notebook at https://t.co/EZt0agsdlV and name it AnythingOfYourChoice.ipynb
You got your notebook ready and now the game is on!
You can add code in these cells and add as many cells as you want
# Importing Libraries
Imports are pretty standard, with a few exceptions.
For the most part, you can import your libraries by running the import.
Type this in the first cell you see. You need not worry about what each of these does, we will understand it later.
