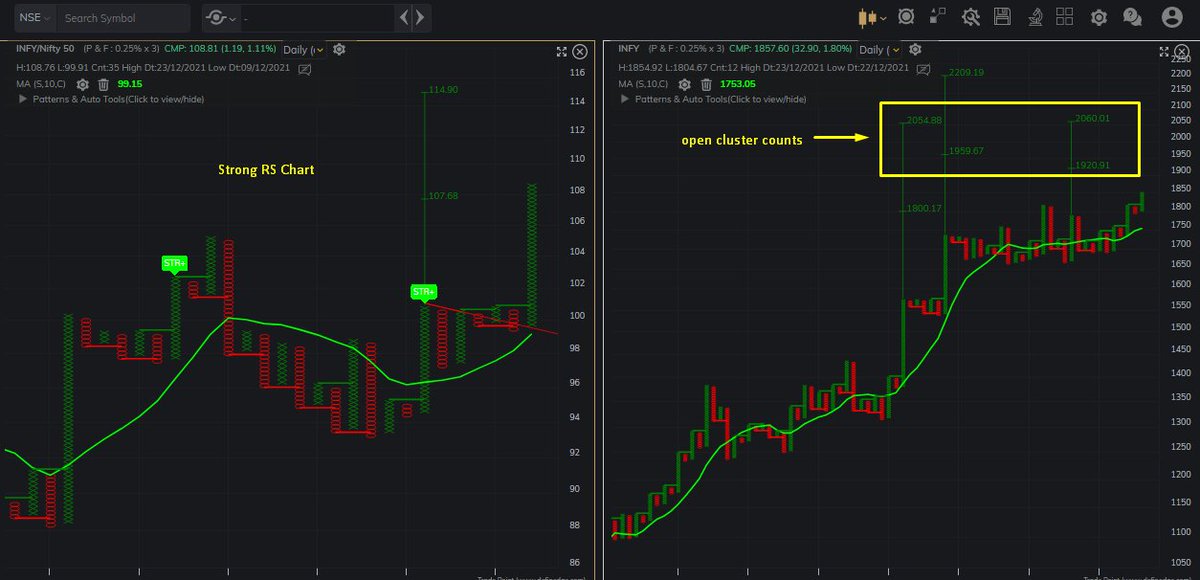
#infy weekly chart
stock has support near 1320 (weekly mid bollinger)
Weekly RSI steadily 50+
If able to sustain above 5 Week low EMA, 1326 it can move towards 1391(5 week highEMA) & 1425 (Uppel Bol Band weekly) in coming weeks
#Nifty #NIFTYIT
Not trading call, academic post

More from Techno Prince
Pls go to Nifty daily chart, convert candle stick chart to line chart
Make time period Weekly
Then click on the encircled + sign in top panel to add different index to compare, u can add any index
Will describe this in our Friday post market session, watch in SE YouTube channel
Make time period Weekly
Then click on the encircled + sign in top panel to add different index to compare, u can add any index
Will describe this in our Friday post market session, watch in SE YouTube channel
Sir can u please make a video on how to get this plotted in trading view .Please sir .a small guidance will be highly appreciated .I know there are many like me who don't know to plot it but are shy to admit .it would benefit them too .thank u sir
— rajesh shetty (@shettyrajeshs) May 4, 2021