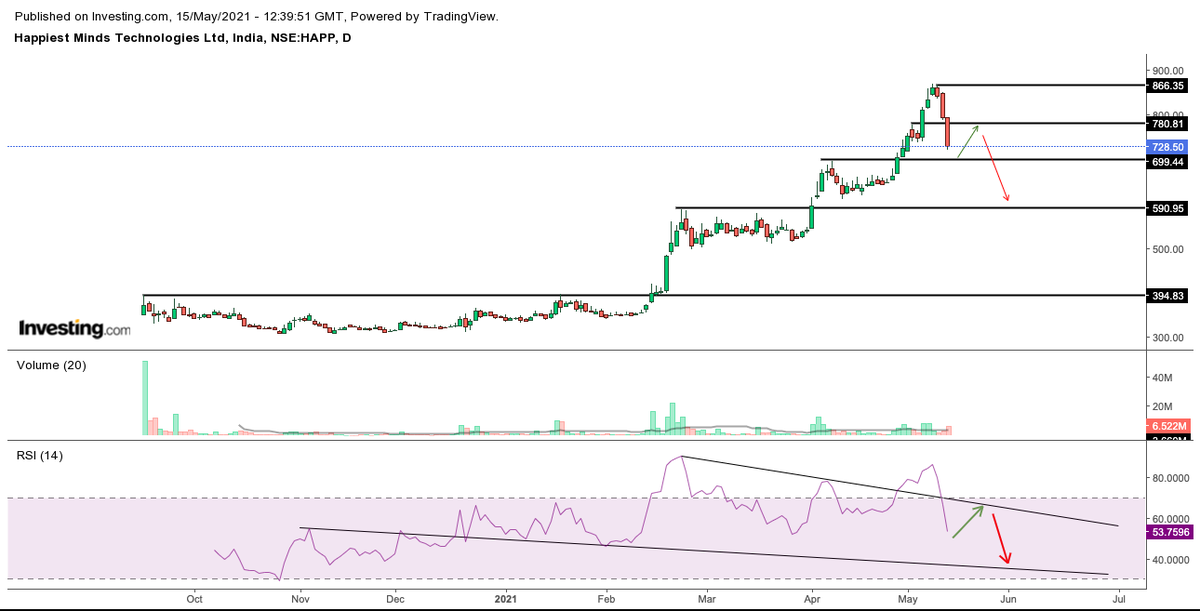
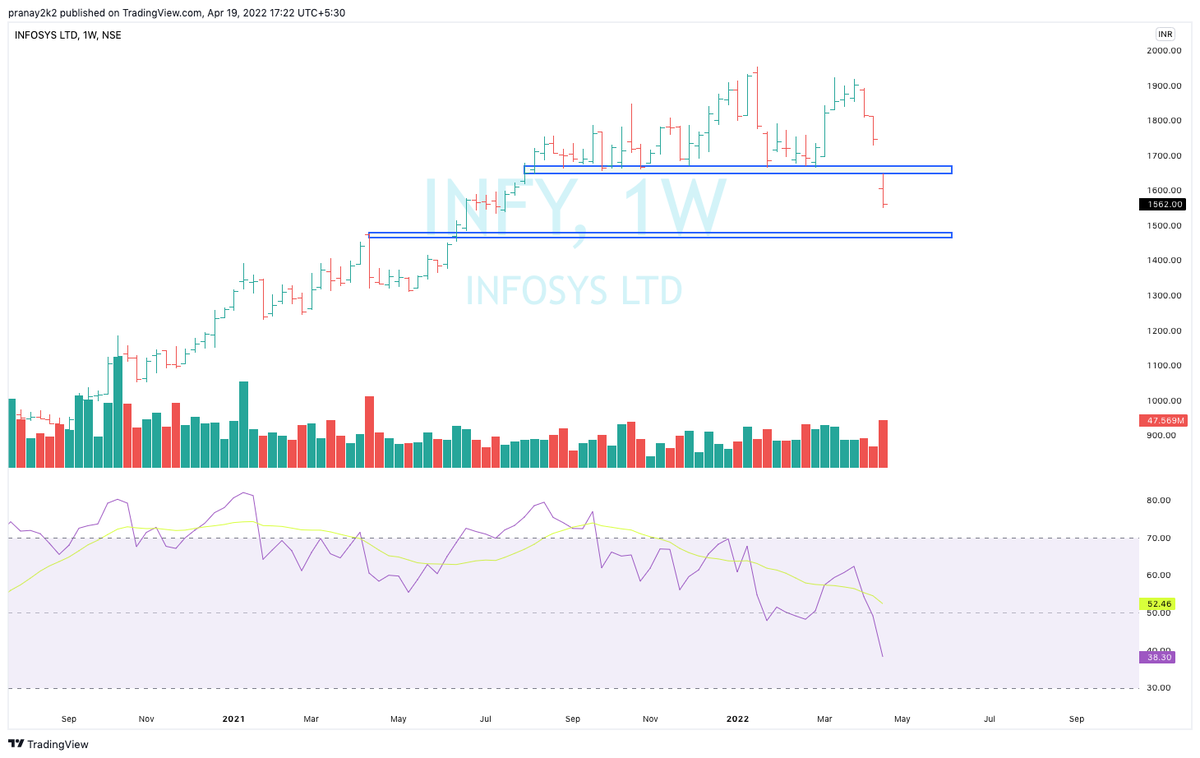
#happiestminds Expecting breakdown retest and then downside 🤞
Pattern fail in case of breakout
More from Pranay Prasun

More from Happymind


The reason why I preferred #happiestminds to include in long term portfolio
Since then MCAP has moved from 7.5k Cr to 10.5k Cr which is more than 40% returns..
I feel it's a start for a long journey for this one.. do read the thread and study 👇
Since then MCAP has moved from 7.5k Cr to 10.5k Cr which is more than 40% returns..
I feel it's a start for a long journey for this one.. do read the thread and study 👇
Thread 4/6
— TheMillionaire \U0001f1ee\U0001f1f3 (@BornToBeSucceed) April 2, 2021
Financial Data since March 2019\U0001f447
Revenue jumped 590 Cr to 739 Cr
(CAGR of 13.7%)
Interesting facts: Profit jumped from 14 Cr to 132 Cr and that's Incredible ( CAGR of 260%) \U0001f680\U0001f680 pic.twitter.com/hj02EMzOHq

#HappiestMinds Bhai thoda correct hoja, mujhe buy karna hai!! haha. https://t.co/sDJrKPyNzT

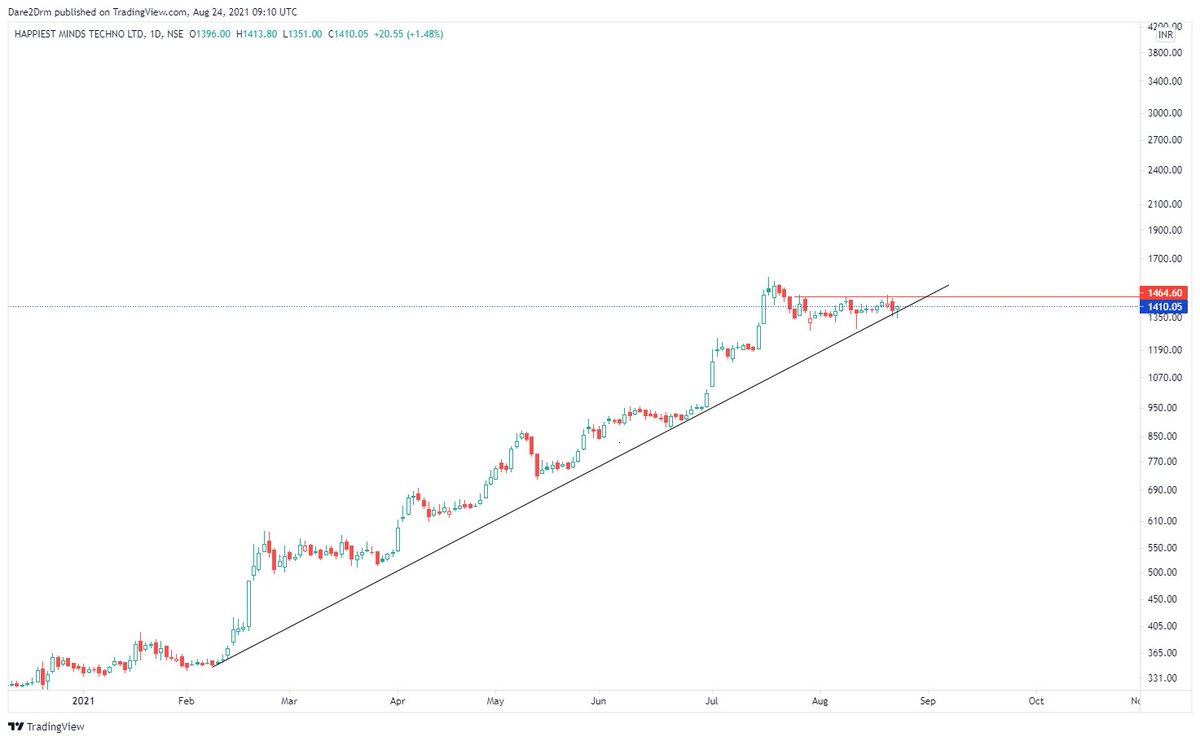
#RecentIPOs I am posting charts of IPOs listed since 2019 showing decent patterns. This is my understanding and no recommendation#HappiestMinds Just broken out again pic.twitter.com/wMaqKYVAeP
— Dare2Dream (@Dare2Dr10109801) April 3, 2021