
Who are “WHITE HATS?”
The “White Hats” is an allegorical reference to the “good guys” taken from American movie tradition, in which the good cowboys always wore white hats and the bad guys (bandits, rustlers, thugs) wore black hats.
Used to refer to the secret group;

More from Government


'Peaceful transition to Military Power....'
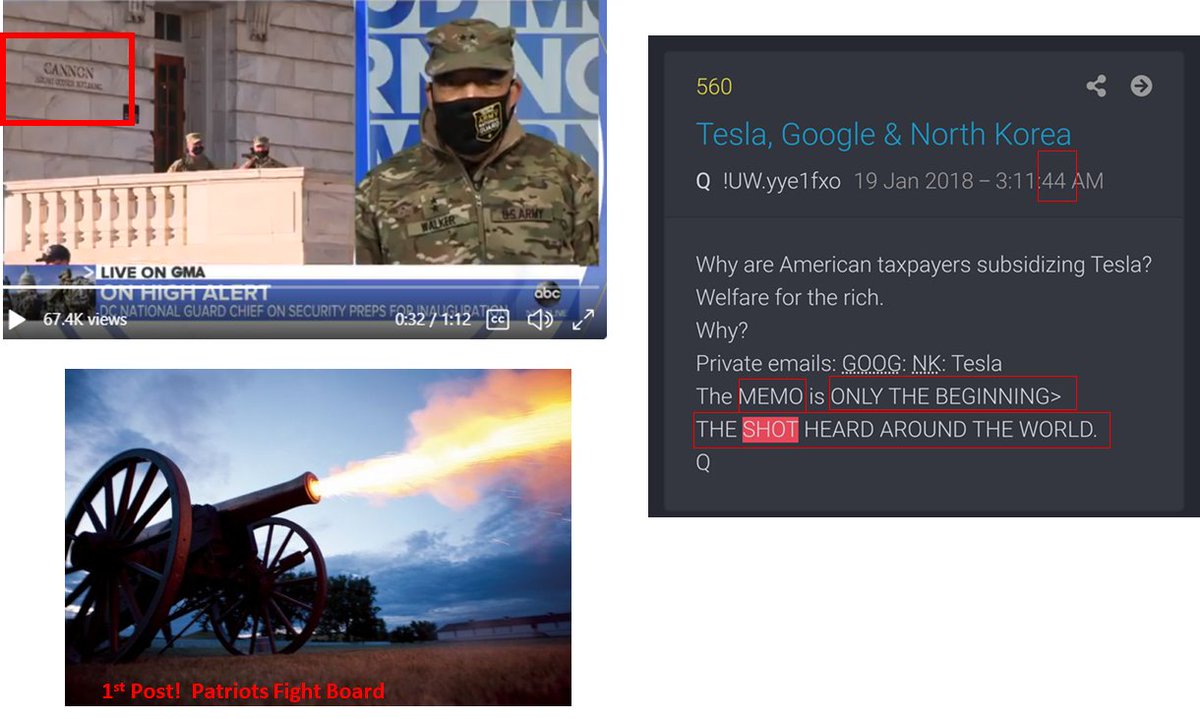
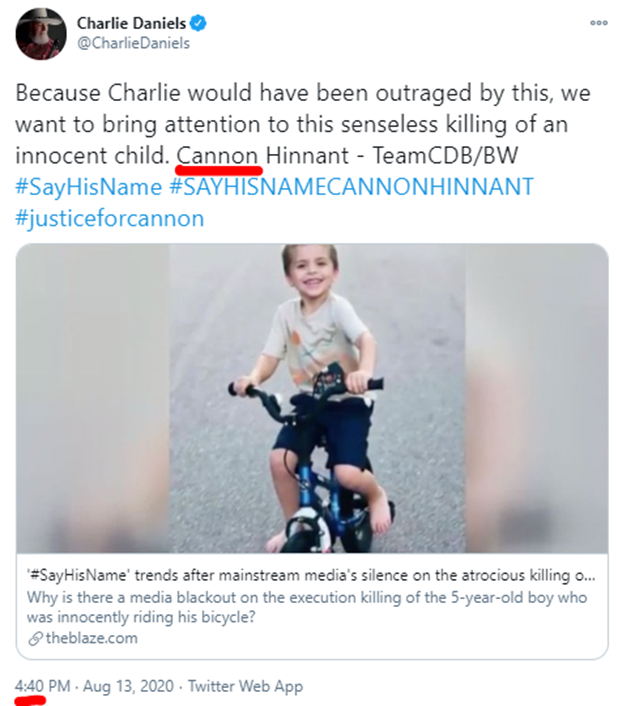
Cannon
44
....heard around the world
NG - High Alert https://t.co/lfeSiUCCRB
We Will Never Forget
44
Stage is set
https://t.co/h6G3LCevII
Following the 44 trail of breadrumbs
https://t.co/PcX0uKUEUW
Cannon
44
....heard around the world
NG - High Alert https://t.co/lfeSiUCCRB
\U0001f4a5 BOOM \U0001f4a5
— R\u0113d.P\u012bll.Ph\u0101rm\u0101c\u012bst (@Red_Pill_Pharma) January 18, 2021
30 secs in - what do I hear?
\u2018Peaceful transition to military power\u2019
\U0001f1fa\U0001f1f8 MILITARY IS THE ONLY WAY \U0001f1fa\U0001f1f8 pic.twitter.com/9NPMT7N7Qy
We Will Never Forget
44
Stage is set
https://t.co/h6G3LCevII
The stage is set. Staged.
— JeLove (@LovesTheLight) November 7, 2020
Where? (the) Delaware.
10:44
Purple
First graphic in 98https://t.co/PKHlxp0rzS pic.twitter.com/XCx6pVQTHx
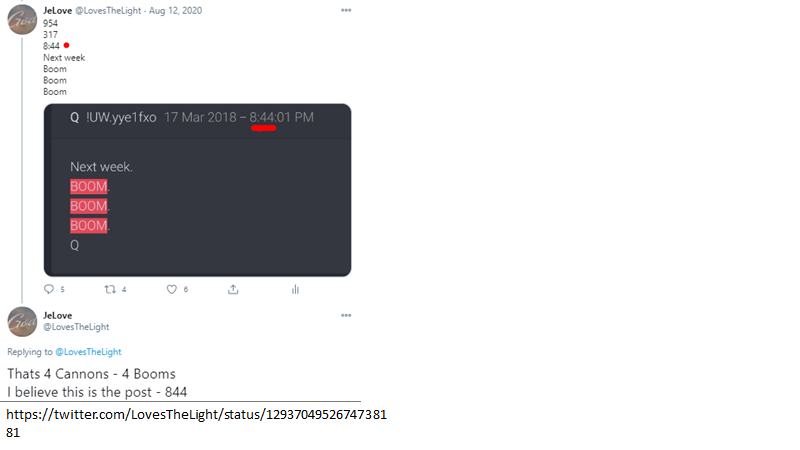
Following the 44 trail of breadrumbs
https://t.co/PcX0uKUEUW
Boom, Boom, Boom pic.twitter.com/ZcZXAgL0Qf
— JeLove (@LovesTheLight) August 13, 2020

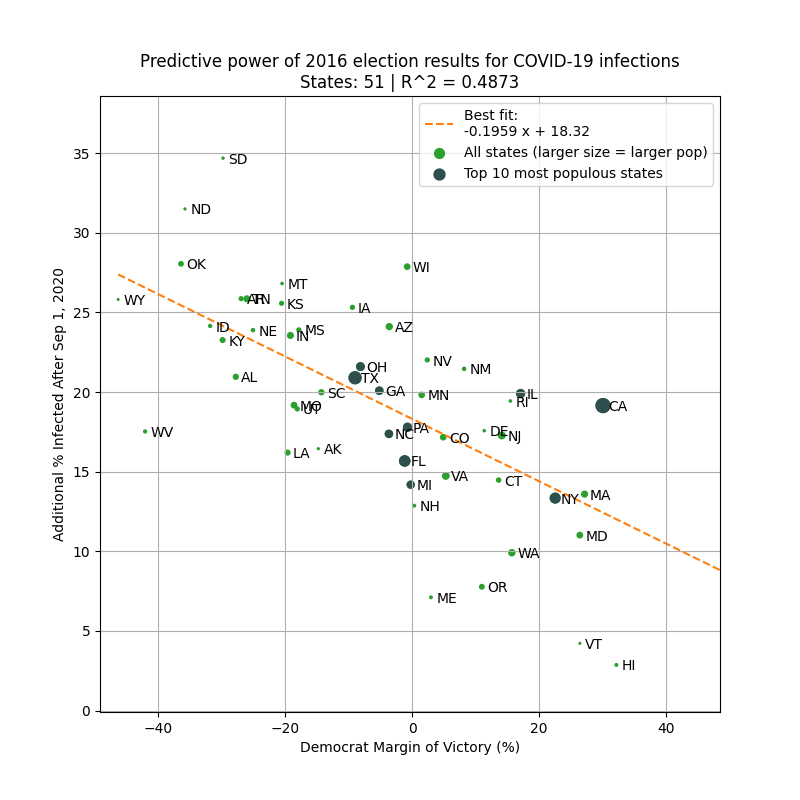
Which metric is a better predictor of the severity of the fall surge in US states?
1) Margin of Democrat victory in Nov 2020 election
or
2) % infected through Sep 1, 2020
Can you guess which plot is which?

The left plot is based on the % infected through Sep 1, 2020. You can see that there is very little correlation with the % infected since Sep 1.
However, there is a *strong* correlation when using the margin of Biden's victory (right).
Infections % from https://t.co/WcXlfxv3Ah.

This is the strongest single variable I've seen in being able to explain the severity of this most recent wave in each state.
Not past infections / existing immunity, population density, racial makeup, latitude / weather / humidity, etc.
But political lean.
One can argue that states that lean Democrat are more likely to implement restrictions/mandates.
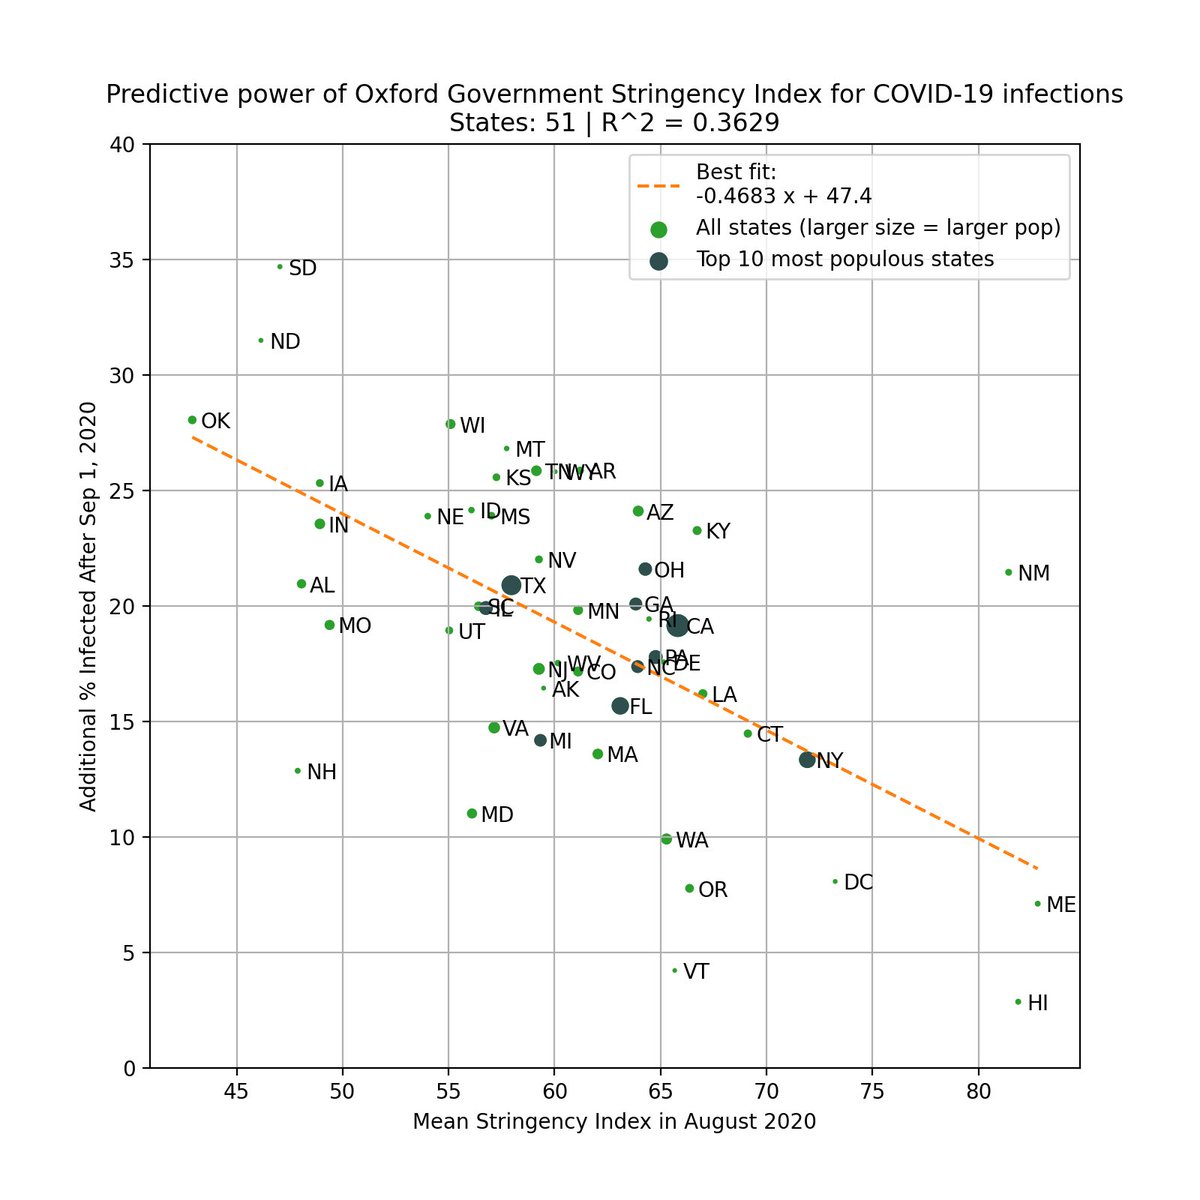
This is valid, so we test this by using the Government Stringency Index made by @UniofOxford.
We also see a correlation, but it's weaker (R^2=0.36 vs 0.50).
https://t.co/BxBBKwW6ta
To avoid look-ahead bias/confounding variables, here is the same analysis but using 2016 margin of victory as the predictor. Similar results.
This basically says that 2016 election results is a better predictor of the severity of the fall wave than intervention levels in 2020!
1) Margin of Democrat victory in Nov 2020 election
or
2) % infected through Sep 1, 2020
Can you guess which plot is which?
The left plot is based on the % infected through Sep 1, 2020. You can see that there is very little correlation with the % infected since Sep 1.
However, there is a *strong* correlation when using the margin of Biden's victory (right).
Infections % from https://t.co/WcXlfxv3Ah.
This is the strongest single variable I've seen in being able to explain the severity of this most recent wave in each state.
Not past infections / existing immunity, population density, racial makeup, latitude / weather / humidity, etc.
But political lean.
One can argue that states that lean Democrat are more likely to implement restrictions/mandates.
This is valid, so we test this by using the Government Stringency Index made by @UniofOxford.
We also see a correlation, but it's weaker (R^2=0.36 vs 0.50).
https://t.co/BxBBKwW6ta
To avoid look-ahead bias/confounding variables, here is the same analysis but using 2016 margin of victory as the predictor. Similar results.
This basically says that 2016 election results is a better predictor of the severity of the fall wave than intervention levels in 2020!

You May Also Like


"I really want to break into Product Management"
make products.
"If only someone would tell me how I can get a startup to notice me."
Make Products.
"I guess it's impossible and I'll never break into the industry."
MAKE PRODUCTS.
Courtesy of @edbrisson's wonderful thread on breaking into comics – https://t.co/TgNblNSCBj – here is why the same applies to Product Management, too.
There is no better way of learning the craft of product, or proving your potential to employers, than just doing it.
You do not need anybody's permission. We don't have diplomas, nor doctorates. We can barely agree on a single standard of what a Product Manager is supposed to do.
But – there is at least one blindingly obvious industry consensus – a Product Manager makes Products.
And they don't need to be kept at the exact right temperature, given endless resource, or carefully protected in order to do this.
They find their own way.
make products.
"If only someone would tell me how I can get a startup to notice me."
Make Products.
"I guess it's impossible and I'll never break into the industry."
MAKE PRODUCTS.
Courtesy of @edbrisson's wonderful thread on breaking into comics – https://t.co/TgNblNSCBj – here is why the same applies to Product Management, too.
"I really want to break into comics"
— Ed Brisson (@edbrisson) December 4, 2018
make comics.
"If only someone would tell me how I can get an editor to notice me."
Make Comics.
"I guess it's impossible and I'll never break into the industry."
MAKE COMICS.
There is no better way of learning the craft of product, or proving your potential to employers, than just doing it.
You do not need anybody's permission. We don't have diplomas, nor doctorates. We can barely agree on a single standard of what a Product Manager is supposed to do.
But – there is at least one blindingly obvious industry consensus – a Product Manager makes Products.
And they don't need to be kept at the exact right temperature, given endless resource, or carefully protected in order to do this.
They find their own way.