
Okayyyy, I’ll join everyone else in responding to today’s news (instead of just sighing, gazing into middle distance). The profit incentive baked into private prisons is a mess. But you know what else is a HUGE MESS?
The revenue incentive in the federal jail market. 🧵
The wonderful Jack Norton @jcknorton calls this “an intercounty carceral arms race... to build and bigger and bigger jails.”
https://t.co/98s22r2fWL
of people detained by the Marshals increased 32 percent in ONE YEAR.
This is a terrible system all of the time. As @jcknorton found in Glades County, FL, it can create this whole new WEIRD system of private profits, going to investors who back big new jails.
https://t.co/EsTK4wd7EX
https://t.co/DuSz7HtEHp
https://t.co/35ggeNKe0E
https://t.co/qljBoNGHaa
https://t.co/fc0Gv6plwr
More from Government

Let me take a stab at this after years of reporting on Marine One, HMX-1, Continuity of Government, etc. None of this is definitive, but it could help explain what folks are seeing:
1.) HMX-1, which flies the VH-3D and VH-60N 'White Top' helicopters used to move... 1/X
the President and VP around, those helos being called Marine One or Two when either is onboard, need to train. The urban landing zones, including WH and VP Residence, are not simple to get in and out of. So, crews need some currency training. They are not just tasked with... 2/X
moving POTUS and VP to get them around the region and to Andrews AFB for long-haul flights, they are essential to Continuity of Government operations. This means that if a threat were to emerge, they need to be ready to snatch POTUS and VP in minutes. This is partially... 3/X
why they have a full forward operating location at Naval Support Activity Anacostia, just 3 miles from the WH. As such, practice is important and considering the state of things, it is critical now more than in any recent memory. 4/X
2.) Considering what happened last week, including mobs of Trump supporters screaming in unison to hang the VP for doing what the constitution states, absolutely despicable in every way, security has been tightened just as it has been all over. Using the helicopters instead.. 5/X
1.) HMX-1, which flies the VH-3D and VH-60N 'White Top' helicopters used to move... 1/X
Very noisy helicopters flying around Vice President\u2019s residence \u2014 what is going on? pic.twitter.com/XPs1A3px7m
— Michael Beschloss (@BeschlossDC) January 11, 2021
the President and VP around, those helos being called Marine One or Two when either is onboard, need to train. The urban landing zones, including WH and VP Residence, are not simple to get in and out of. So, crews need some currency training. They are not just tasked with... 2/X
moving POTUS and VP to get them around the region and to Andrews AFB for long-haul flights, they are essential to Continuity of Government operations. This means that if a threat were to emerge, they need to be ready to snatch POTUS and VP in minutes. This is partially... 3/X
why they have a full forward operating location at Naval Support Activity Anacostia, just 3 miles from the WH. As such, practice is important and considering the state of things, it is critical now more than in any recent memory. 4/X
2.) Considering what happened last week, including mobs of Trump supporters screaming in unison to hang the VP for doing what the constitution states, absolutely despicable in every way, security has been tightened just as it has been all over. Using the helicopters instead.. 5/X


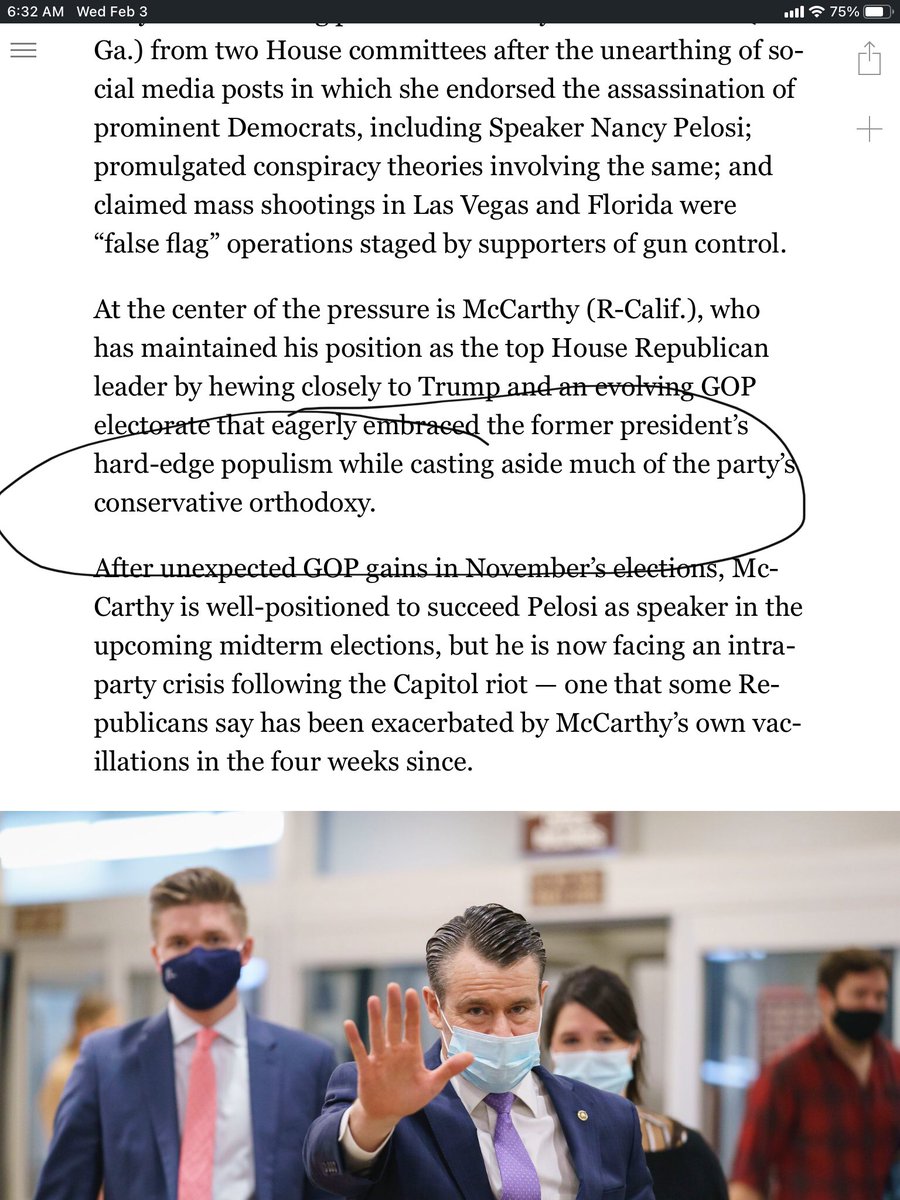
This is a good piece on fissures within the GOP but I think it mischaracterizes the Trump presidency as “populist” & repeats a story about how conservatives & the GOP expelled the far-right in the mid-1960s that is actually far more complicated. /1
I don’t think the sharp opposition between “hard-edge populism” & “conservative orthodoxy” holds. Many of the Trump administration’s achievements were boilerplate conservatism. Its own website trumpets things like “massive deregulation,” tax cuts, etc. /2
https://t.co/N97v85Bb79
The claim that Buckley and “key GOP politicians banded together to marginalize anti-Communist extremism and conspiracy-mongering” of the JBS has been widely repeated lately but the history is more complicated. /3
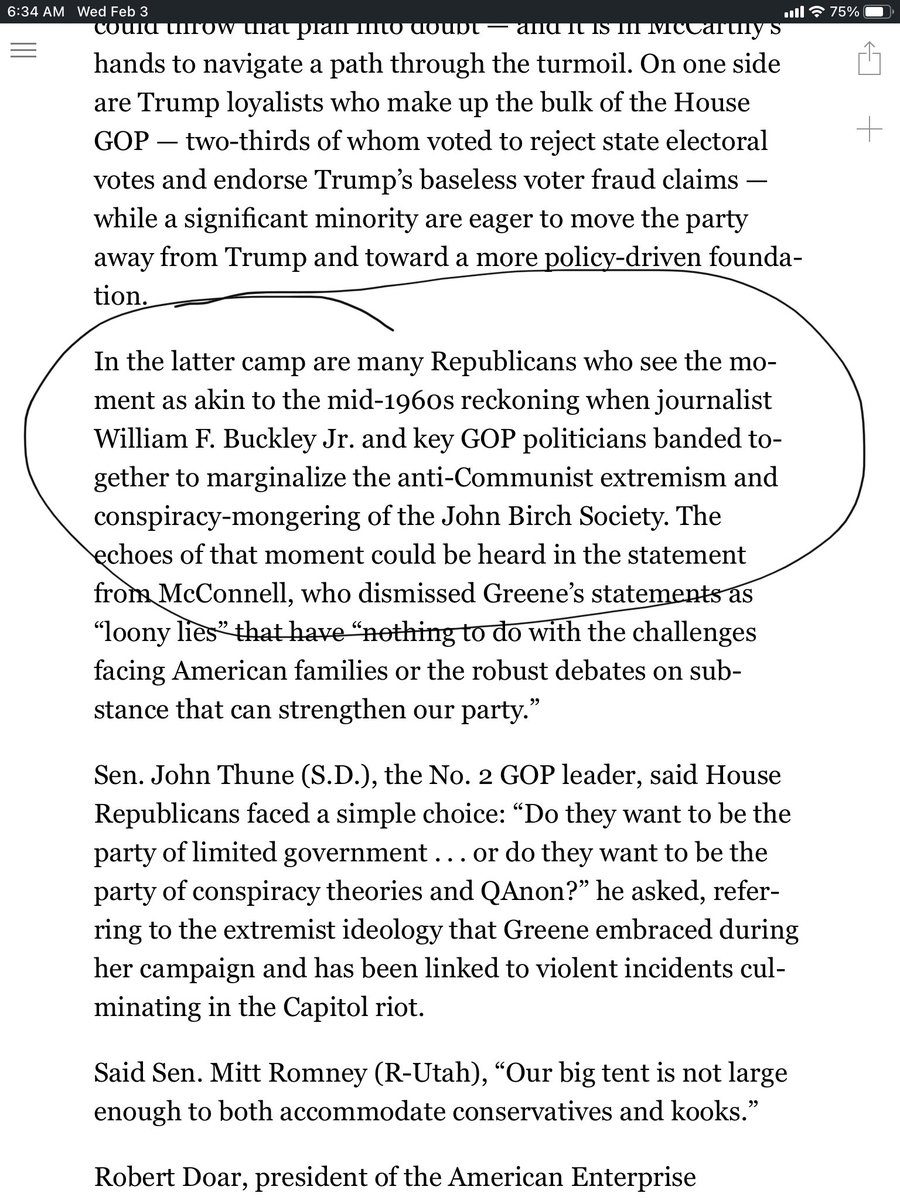
This tweet by @ThePlumLineGS citing a paper by @sam_rosenfeld and @daschloz on the "porous" boundary between conservatives, the GOP and the far-right is relevant in this context.
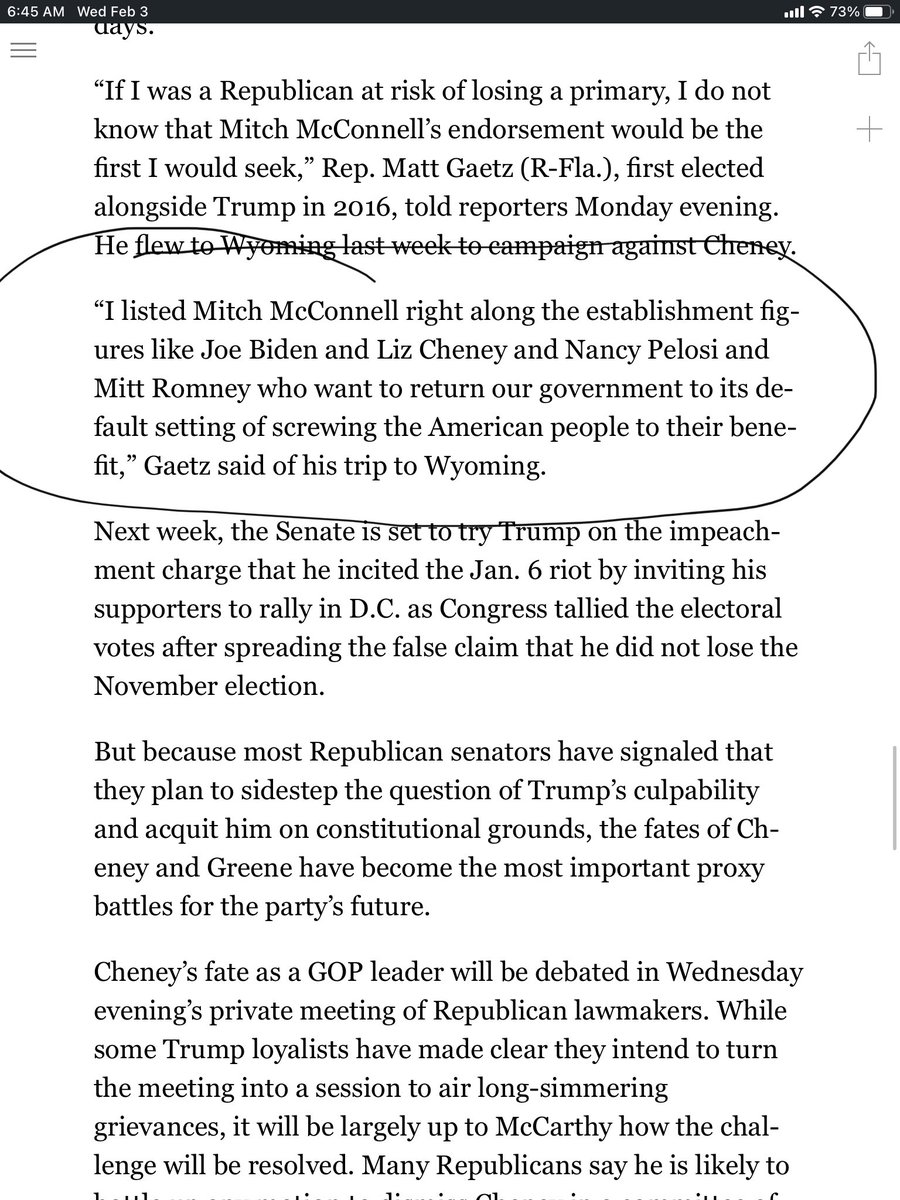
This is a separate point but I find it interesting that Gaetz, like Roy Moore did In his failed Senate campaign, disses McConnell. What are their actual policy differences? MM supported taking health care away from millions, a tax cut for the rich, conservative judges, etc. /5
I don’t think the sharp opposition between “hard-edge populism” & “conservative orthodoxy” holds. Many of the Trump administration’s achievements were boilerplate conservatism. Its own website trumpets things like “massive deregulation,” tax cuts, etc. /2
https://t.co/N97v85Bb79
The claim that Buckley and “key GOP politicians banded together to marginalize anti-Communist extremism and conspiracy-mongering” of the JBS has been widely repeated lately but the history is more complicated. /3
This tweet by @ThePlumLineGS citing a paper by @sam_rosenfeld and @daschloz on the "porous" boundary between conservatives, the GOP and the far-right is relevant in this context.
There's a great paper called "The Long New Right" that tells the story of the GOP/conservative movement's failure to police extremists for the last 50 years.
— Greg Sargent (@ThePlumLineGS) January 28, 2021
It's highly relevant to the insurrection and Marjorie Greene's lunacy.
I summed it up here:https://t.co/DTlzGomy5h pic.twitter.com/Dhc38CDuE2
This is a separate point but I find it interesting that Gaetz, like Roy Moore did In his failed Senate campaign, disses McConnell. What are their actual policy differences? MM supported taking health care away from millions, a tax cut for the rich, conservative judges, etc. /5


You May Also Like


The YouTube algorithm that I helped build in 2011 still recommends the flat earth theory by the *hundreds of millions*. This investigation by @RawStory shows some of the real-life consequences of this badly designed AI.
This spring at SxSW, @SusanWojcicki promised "Wikipedia snippets" on debated videos. But they didn't put them on flat earth videos, and instead @YouTube is promoting merchandising such as "NASA lies - Never Trust a Snake". 2/

A few example of flat earth videos that were promoted by YouTube #today:
https://t.co/TumQiX2tlj 3/
https://t.co/uAORIJ5BYX 4/
https://t.co/yOGZ0pLfHG 5/
Flat Earth conference attendees explain how they have been brainwashed by YouTube and Infowarshttps://t.co/gqZwGXPOoc
— Raw Story (@RawStory) November 18, 2018
This spring at SxSW, @SusanWojcicki promised "Wikipedia snippets" on debated videos. But they didn't put them on flat earth videos, and instead @YouTube is promoting merchandising such as "NASA lies - Never Trust a Snake". 2/
A few example of flat earth videos that were promoted by YouTube #today:
https://t.co/TumQiX2tlj 3/
https://t.co/uAORIJ5BYX 4/
https://t.co/yOGZ0pLfHG 5/


"I lied about my basic beliefs in order to keep a prestigious job. Now that it will be zero-cost to me, I have a few things to say."
We know that elite institutions like the one Flier was in (partial) charge of rely on irrelevant status markers like private school education, whiteness, legacy, and ability to charm an old white guy at an interview.
Harvard's discriminatory policies are becoming increasingly well known, across the political spectrum (see, e.g., the recent lawsuit on discrimination against East Asian applications.)
It's refreshing to hear a senior administrator admits to personally opposing policies that attempt to remedy these basic flaws. These are flaws that harm his institution's ability to do cutting-edge research and to serve the public.
Harvard is being eclipsed by institutions that have different ideas about how to run a 21st Century institution. Stanford, for one; the UC system; the "public Ivys".
As a dean of a major academic institution, I could not have said this. But I will now. Requiring such statements in applications for appointments and promotions is an affront to academic freedom, and diminishes the true value of diversity, equity of inclusion by trivializing it. https://t.co/NfcI5VLODi
— Jeffrey Flier (@jflier) November 10, 2018
We know that elite institutions like the one Flier was in (partial) charge of rely on irrelevant status markers like private school education, whiteness, legacy, and ability to charm an old white guy at an interview.
Harvard's discriminatory policies are becoming increasingly well known, across the political spectrum (see, e.g., the recent lawsuit on discrimination against East Asian applications.)
It's refreshing to hear a senior administrator admits to personally opposing policies that attempt to remedy these basic flaws. These are flaws that harm his institution's ability to do cutting-edge research and to serve the public.
Harvard is being eclipsed by institutions that have different ideas about how to run a 21st Century institution. Stanford, for one; the UC system; the "public Ivys".