Has anybody done a comparative study on all the Gold ETFs listed, performance and tracking error
Thanks in advance
More from Alok Jain ⚡
Not letting your capital rot is a gainful activity. https://t.co/iYo2SIEPVX
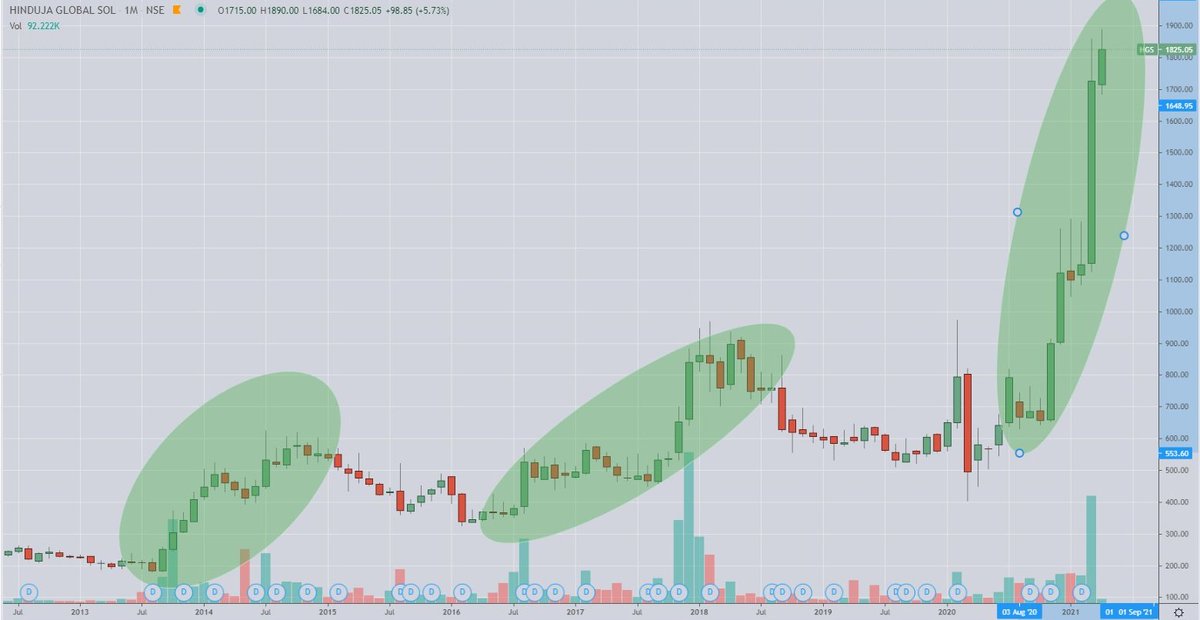
whats cooking in HGS ??
— Alok Jain \u26a1 (@WeekendInvestng) April 1, 2021
Are Hindujas offloading to put more into Indus ?? What's the buzz... the move seems as a precursor to a big news
just a guess..not a reco
More from Gold
GOLD https://t.co/l6pEGDpAkL
Most interesting chart:
— The_Chartist \U0001f4c8 (@charts_zone) February 12, 2022
Orange line = Gold
Blue Curve = Gold/S&P 500
Previously the ratio crossed 50 days MA in Feb' 20 with Gold giving a breakout on the charts. The previous cross of 50 days MA didn't result in gold breaking out. pic.twitter.com/HRG1fvsILp
Do re-tweet and help us educate more retail investors
#investing
What better day to discuss Gold, isn\u2019t it?
— Kirtan A Shah (@KirtanShahCFP) November 13, 2020
Topic - Physical Gold v/s Digital Gold v/s Gold ETF v/s Sovereign Gold Bond (SGB)
(Thread) \u2013 DO RE-TWEET FOR A LARGER REACH :)
(1/n)
Result?
1850$ to 2070$
Updated chart https://t.co/l6pEGD7r6D
Most interesting chart:
— The_Chartist \U0001f4c8 (@charts_zone) February 12, 2022
Orange line = Gold
Blue Curve = Gold/S&P 500
Previously the ratio crossed 50 days MA in Feb' 20 with Gold giving a breakout on the charts. The previous cross of 50 days MA didn't result in gold breaking out. pic.twitter.com/HRG1fvsILp