The “Should we get rid of the GRE?” conversation and the “Should we pay undergrad RAs $15/hour?” conversation have three things in common that I think are really unfortunate — 🧵
Some musings about graduate admissions, standardized testing, etc while I wait for my coffee.... these are things that seem obvious? but are maybe not obvious?
— Dr. Paige Harden (@kph3k) December 2, 2020
More from Economy
1. HUGE DISCOVERY!
What would have been exposed if @GenFlynn hadn't been impeded by corrupt FBI, DOJ and the Obama White house?
He'd have exposed CHINA and their laundering of IRANIAN OIL MONEY!
Read the thread below for the back story on how they went after Flynn.
What would have been exposed if @GenFlynn hadn't been impeded by corrupt FBI, DOJ and the Obama White house?
He'd have exposed CHINA and their laundering of IRANIAN OIL MONEY!
Read the thread below for the back story on how they went after Flynn.
1. As promised.
— \U0001f1fa\U0001f1f8 \U0001d7dc\U0001d7d8\u210d\U0001d556\U0001d552\U0001d555 \U0001f1fa\U0001f1f8 \u2b50\u2b50\u2b50 \U0001f1fa\U0001f1f8 (@40_head) December 2, 2020
A deep dig covering years of research. This is going to take you committing some real time to get through. What's THIS all about?
A coup. Murder. Treason. Laundering gold for Iran...I think it will blow your mind.
You May Also Like
The first area to focus on is diversity. This has become a dogma in the tech world, and despite the fact that tech is one of the most meritocratic industries in the world, there are constant efforts to promote diversity at the expense of fairness, merit and competency. Examples:
USC's Interactive Media & Games Division cancels all-star panel that included top-tier game developers who were invited to share their experiences with students. Why? Because there were no women on the
ElectronConf is a conf which chooses presenters based on blind auditions; the identity, gender, and race of the speaker is not known to the selection team. The results of that merit-based approach was an all-male panel. So they cancelled the conference.
Apple's head of diversity (a black woman) got in trouble for promoting a vision of diversity that is at odds with contemporary progressive dogma. (She left the company shortly after this
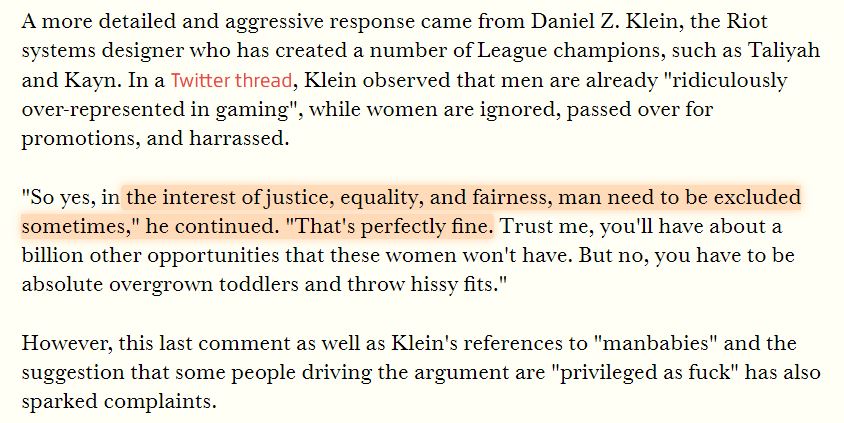
Also in the name of diversity, there is unabashed discrimination against men (especially white men) in tech, in both hiring policies and in other arenas. One such example is this, a developer workshop that specifically excluded men: https://t.co/N0SkH4hR35


