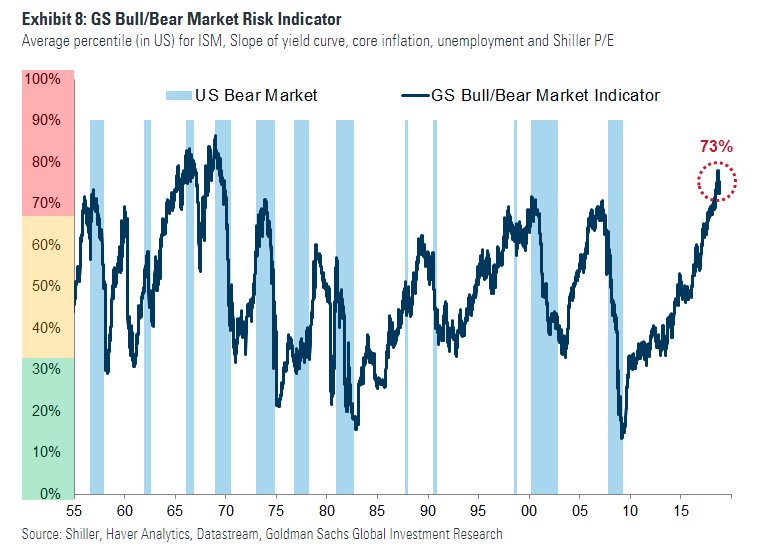
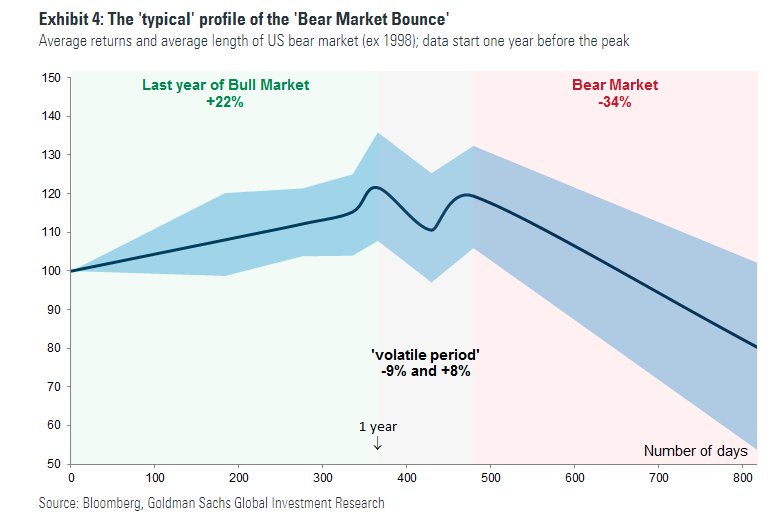
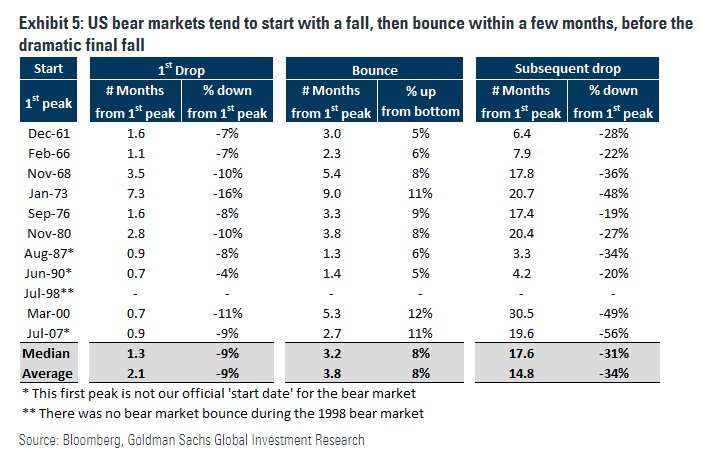
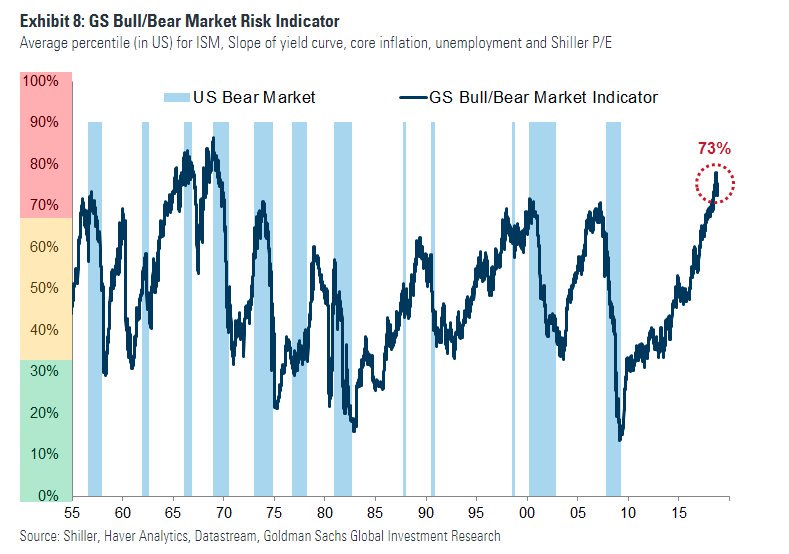
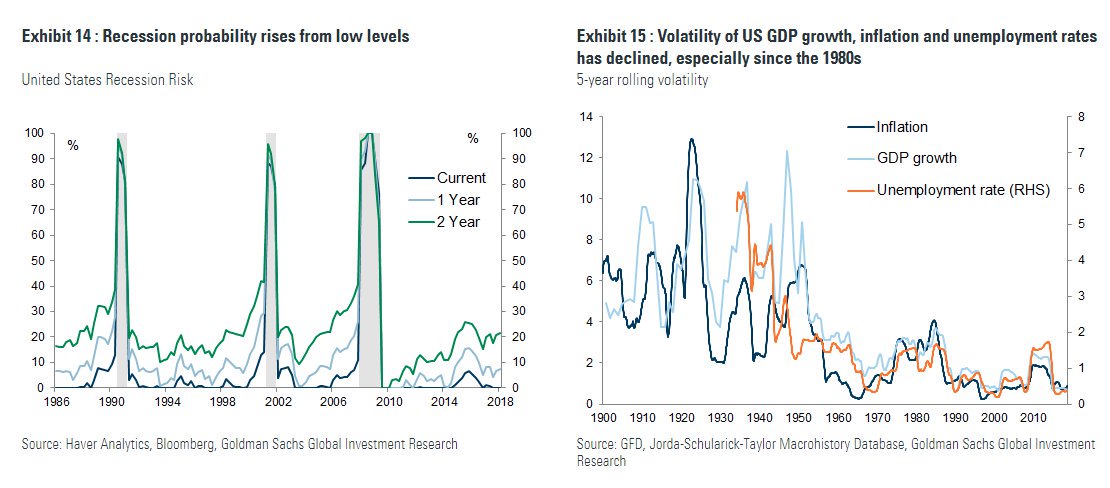
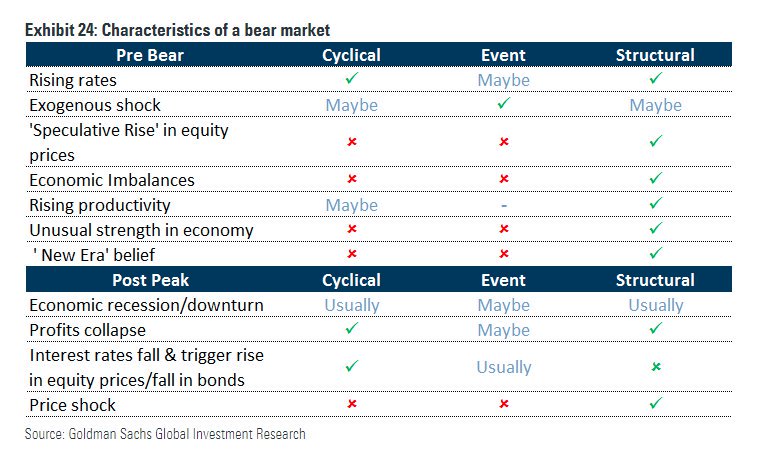
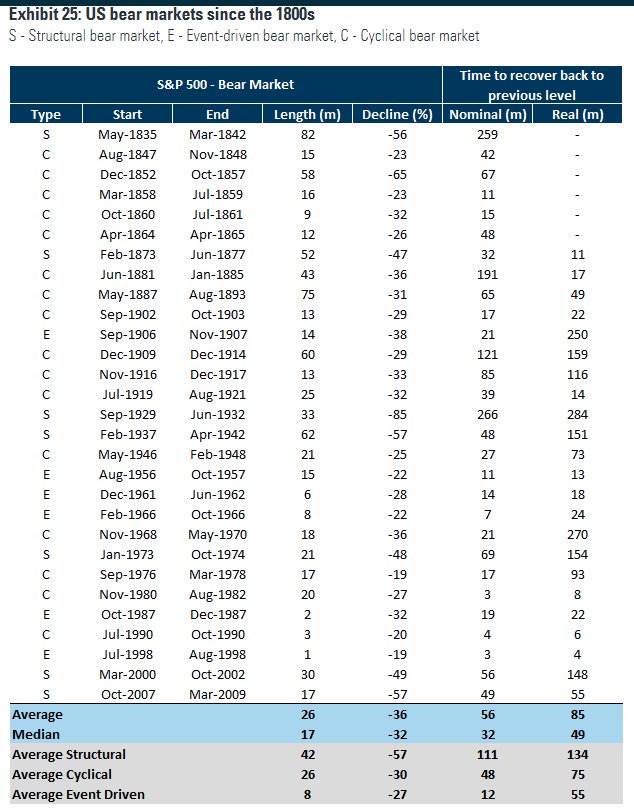
A thread on an interesting report by Goldman Sachs' Peter Oppenheimer, the bank's chief global equity strategist. He points out that Goldman's "Bear Market Risk Indicator" is looking ominous.

More from Economy


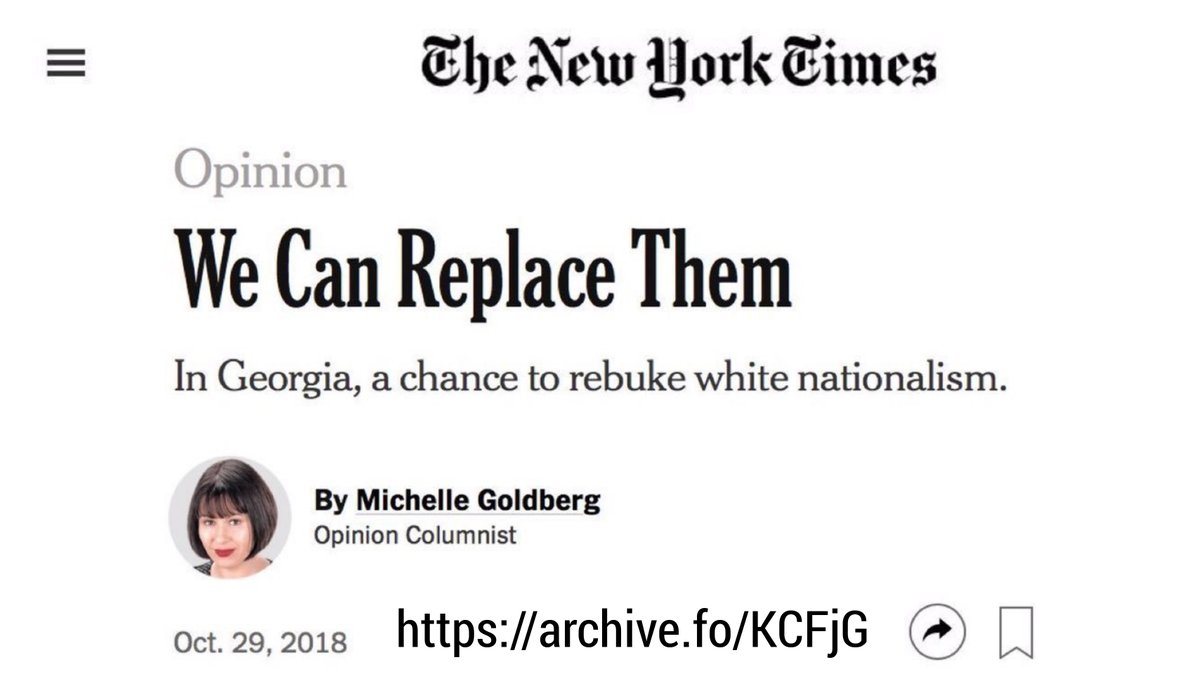
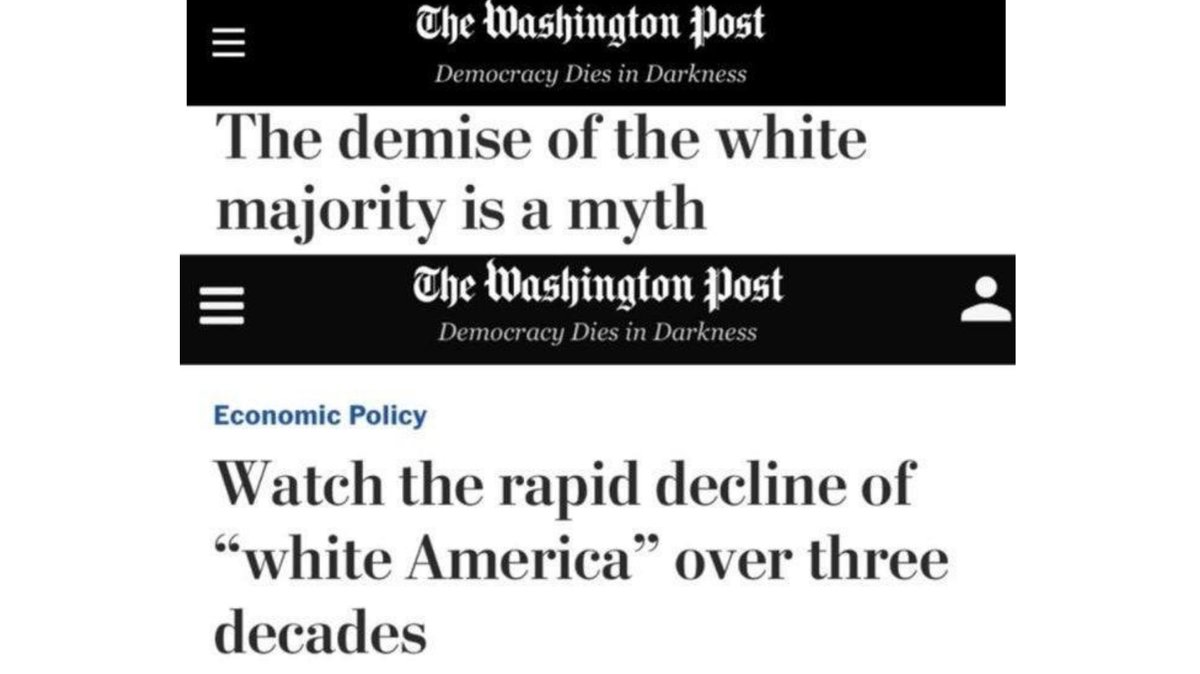
1. "ThE gReAt rEplAcEMeNt iS A cOnSpiRaCy tHEorY" https://t.co/BXdtcNxrVf

2. "ThE gReAt rEplAcEMeNt iS A cOnSpiRaCy tHEorY"
3. "ThE gReAt rEplAcEMeNt iS A cOnSpiRaCy tHEorY"
4. "ThE gReAt rEplAcEMeNt iS A cOnSpiRaCy tHEorY"
5. "ThE gReAt rEplAcEMeNt iS A cOnSpiRaCy tHEorY"

The great replacement isn't a conspiracy theory, it is the inevitable outcome of non-stop immigration of populations whom do not wish to assimilate and have way higher birth rates than the native population... It's purely a mathematical reality.
— Angelo John Gage (@AngeloJohnGage) December 30, 2020
2. "ThE gReAt rEplAcEMeNt iS A cOnSpiRaCy tHEorY"
3. "ThE gReAt rEplAcEMeNt iS A cOnSpiRaCy tHEorY"
4. "ThE gReAt rEplAcEMeNt iS A cOnSpiRaCy tHEorY"
5. "ThE gReAt rEplAcEMeNt iS A cOnSpiRaCy tHEorY"

One of the hardest problems post-pandemic will be how to revive so-called "left behind" places.
Post-industrial towns, run-down suburbs, coastal communities - these places were already struggling before the crisis and have fared worst in the last year.
What should we do?
Today, @ukonward sets out the beginning of a plan to repair our social fabric. It follows our extensive research over the last year, expertly chaired by @jamesosh, and funded by @jrf_uk, @Shelter and @peoplesbiz.
https://t.co/d3T5uPwG9N

Before I get into recommendations, some findings from previous Onward research.
In 2018, we found 71% of people believe "community has declined in my lifetime"
In 2019, we found 65% would rather live in “a society that focuses on giving people more security” vs 35% for freedom

This was the basis for our identification of 'Workington Man' as the archetypal swing voter in 2019, and led us to predict (correctly) that large numbers of Red Wall seats could fall. A key driver was a desire for security, belonging and pride in place.

There is also a key regional dimension to this. We also tested people's affinity with the UK's direction of travel, across both cultural and economic dimensions - revealing the extraordinary spread below: London vs. the Rest.
https://t.co/HrorW4xaLp

Post-industrial towns, run-down suburbs, coastal communities - these places were already struggling before the crisis and have fared worst in the last year.
What should we do?
Today, @ukonward sets out the beginning of a plan to repair our social fabric. It follows our extensive research over the last year, expertly chaired by @jamesosh, and funded by @jrf_uk, @Shelter and @peoplesbiz.
https://t.co/d3T5uPwG9N
Before I get into recommendations, some findings from previous Onward research.
In 2018, we found 71% of people believe "community has declined in my lifetime"
In 2019, we found 65% would rather live in “a society that focuses on giving people more security” vs 35% for freedom
This was the basis for our identification of 'Workington Man' as the archetypal swing voter in 2019, and led us to predict (correctly) that large numbers of Red Wall seats could fall. A key driver was a desire for security, belonging and pride in place.
There is also a key regional dimension to this. We also tested people's affinity with the UK's direction of travel, across both cultural and economic dimensions - revealing the extraordinary spread below: London vs. the Rest.
https://t.co/HrorW4xaLp