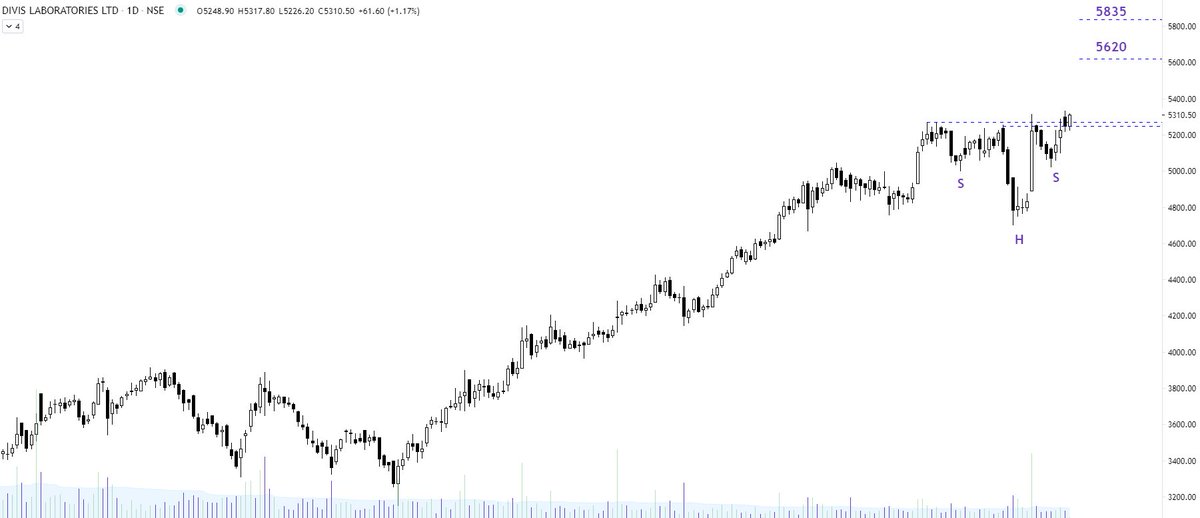
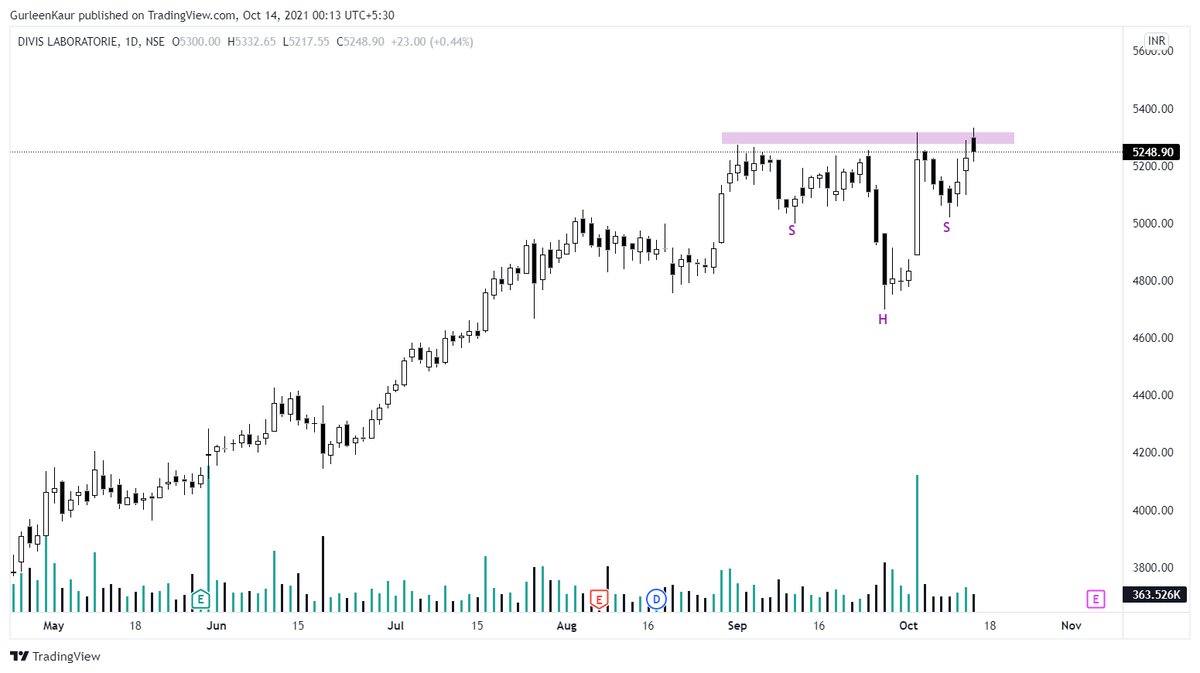
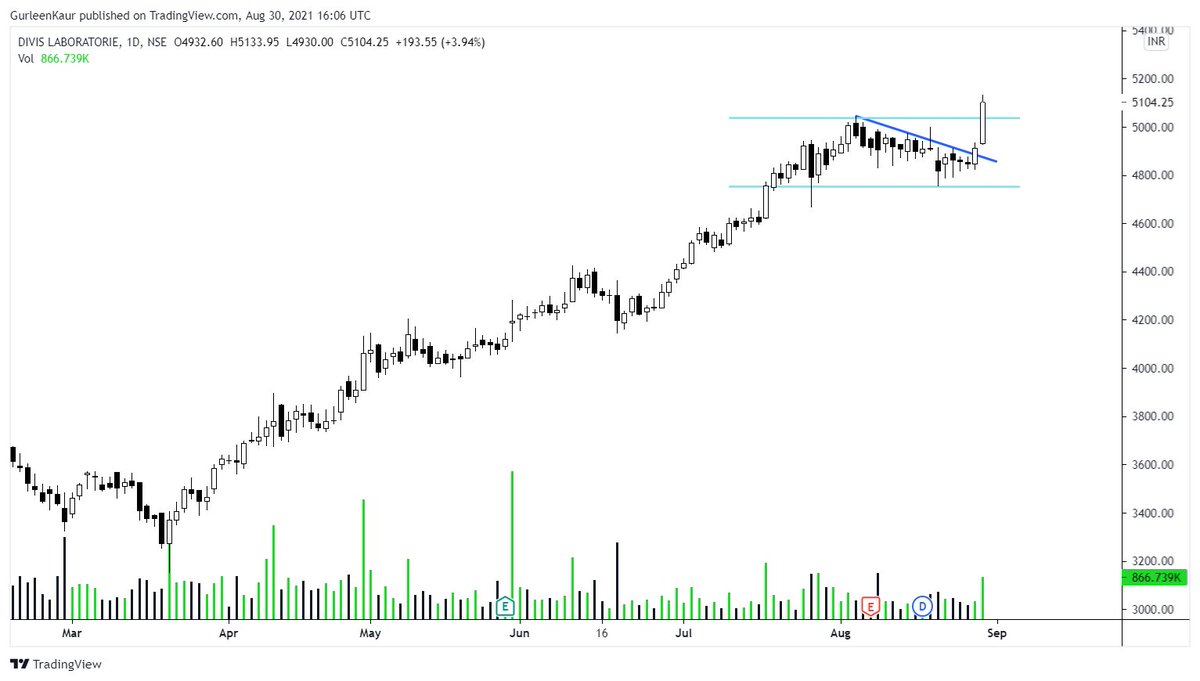
#DIVISLAB
Price fell to a trough and then rose up. Capped at the resistance zone of 5315.50~5332.65
Only a swift move through this price band would open the north bound territory towards new highs.
More from Gurleen
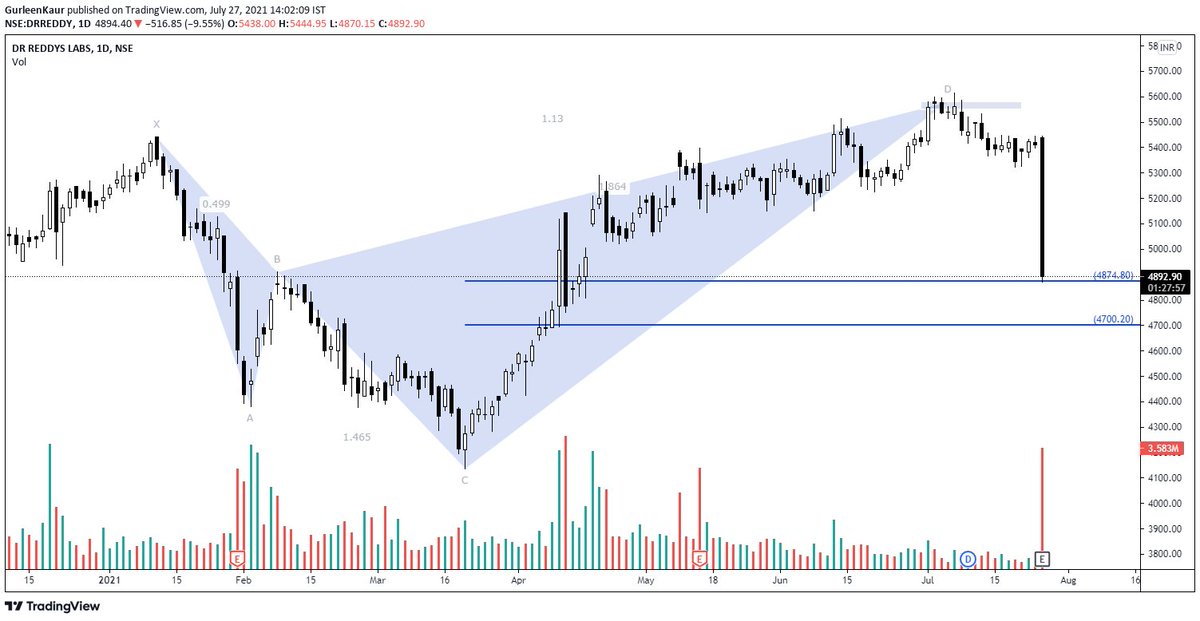
#DRREDDY
Post the Harmonic reversal, Amongst the Pharma sector; #DRREDDY is 10% down.
Strong sell-off, There's a high probability of 4874.80 getting breached. Immediate support at 4700.20
#StockMarket https://t.co/J61wgJdzX7
Post the Harmonic reversal, Amongst the Pharma sector; #DRREDDY is 10% down.
Strong sell-off, There's a high probability of 4874.80 getting breached. Immediate support at 4700.20
#StockMarket https://t.co/J61wgJdzX7
#CNXPHARMA
— Gurleen (@GurleenKaur_19) July 27, 2021
Strong Breakdown but it continues to hold above a crucial support level of 14183.65
Support staying intact or A slip below this level would lead the Index either side. #StockMarket pic.twitter.com/qgBZKB4Cyo

More from Divis

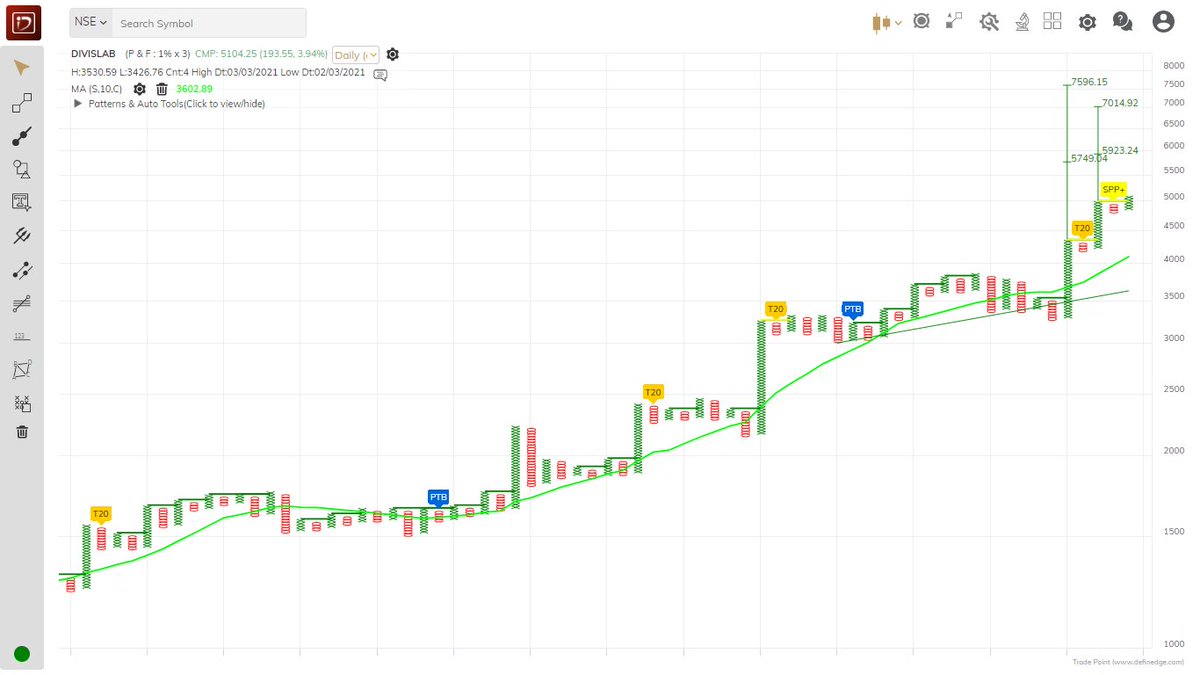
DIVISLAB
Double Top Buy & Super Pattern - Bullish above 5051.46 daily close on 1% Box Size chart. https://t.co/vy43JDtiC9
Double Top Buy & Super Pattern - Bullish above 5051.46 daily close on 1% Box Size chart. https://t.co/vy43JDtiC9
DIVISLAB
— Saket Reddy (@saketreddy) June 29, 2021
Double Top Buy, T20 Pattern - Bullish, Super Pattern - Bullish above 4394.59 daily close on 1% Box Size chart. https://t.co/3F3aLZk5td pic.twitter.com/onK3yuy7nG