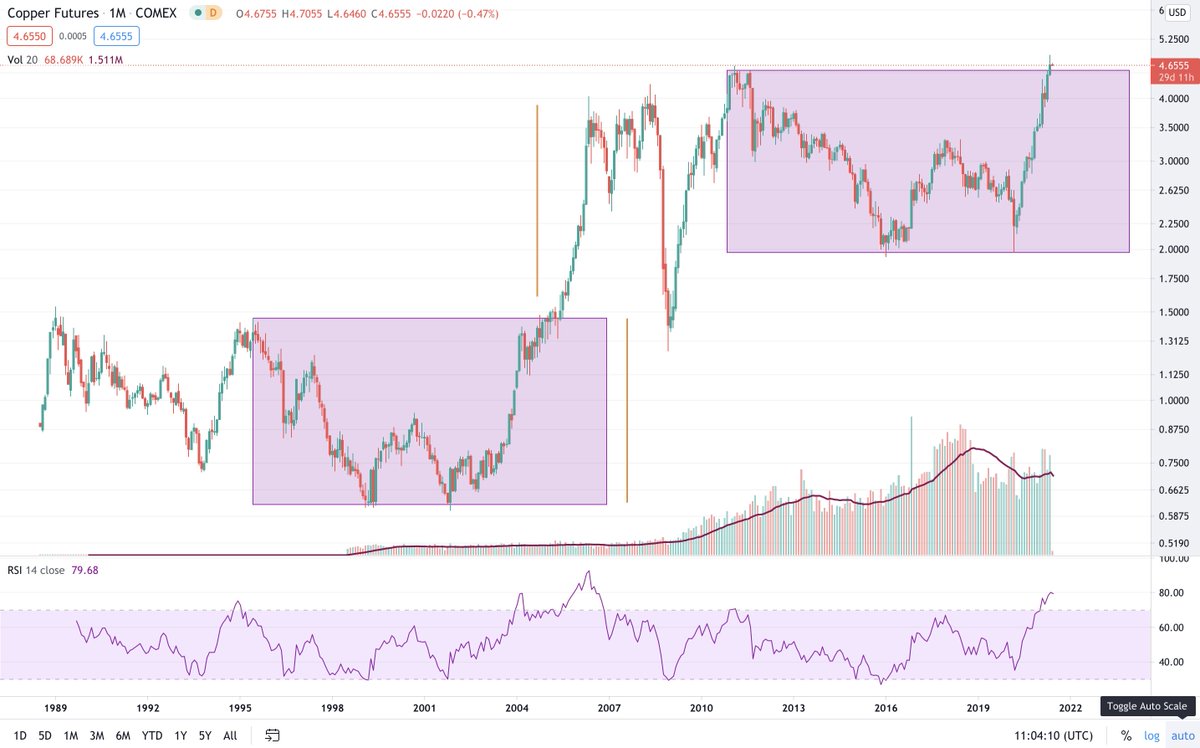
In other news, Copper Futures have broken out and would soon be challenging the 4.34 mark where the IH&S pattern breakout
More from Nishant Kumar
More from Copper
Copper breaching the rising Trendline.
Weekly Candles, so we still need to wait.
Earlier two tweets on Copper:
1. Copper - EM:
https://t.co/WogWRMIMHH
and,
2. Copper - Gold
https://t.co/Cq2zcn4bi3
Weekly Candles, so we still need to wait.
Earlier two tweets on Copper:
1. Copper - EM:
https://t.co/WogWRMIMHH
and,
2. Copper - Gold
https://t.co/Cq2zcn4bi3
Amazingly super positive correlation between Emerging Markets and Copper.
— Piyush Chaudhry (@piyushchaudhry) June 2, 2021
*MSCI Emerging Markets ETF #EEM
*Copper Futures #Comex pic.twitter.com/rVAwfqvqD4
You May Also Like
1/OK, data mystery time.
This New York Times feature shows China with a Gini Index of less than 30, which would make it more equal than Canada, France, or the Netherlands. https://t.co/g3Sv6DZTDE
That's weird. Income inequality in China is legendary.
Let's check this number.
2/The New York Times cites the World Bank's recent report, "Fair Progress? Economic Mobility across Generations Around the World".
The report is available here:
3/The World Bank report has a graph in which it appears to show the same value for China's Gini - under 0.3.
The graph cites the World Development Indicators as its source for the income inequality data.
4/The World Development Indicators are available at the World Bank's website.
Here's the Gini index: https://t.co/MvylQzpX6A
It looks as if the latest estimate for China's Gini is 42.2.
That estimate is from 2012.
5/A Gini of 42.2 would put China in the same neighborhood as the U.S., whose Gini was estimated at 41 in 2013.
I can't find the <30 number anywhere. The only other estimate in the tables for China is from 2008, when it was estimated at 42.8.
This New York Times feature shows China with a Gini Index of less than 30, which would make it more equal than Canada, France, or the Netherlands. https://t.co/g3Sv6DZTDE
That's weird. Income inequality in China is legendary.
Let's check this number.
2/The New York Times cites the World Bank's recent report, "Fair Progress? Economic Mobility across Generations Around the World".
The report is available here:
3/The World Bank report has a graph in which it appears to show the same value for China's Gini - under 0.3.
The graph cites the World Development Indicators as its source for the income inequality data.
4/The World Development Indicators are available at the World Bank's website.
Here's the Gini index: https://t.co/MvylQzpX6A
It looks as if the latest estimate for China's Gini is 42.2.
That estimate is from 2012.
5/A Gini of 42.2 would put China in the same neighborhood as the U.S., whose Gini was estimated at 41 in 2013.
I can't find the <30 number anywhere. The only other estimate in the tables for China is from 2008, when it was estimated at 42.8.