
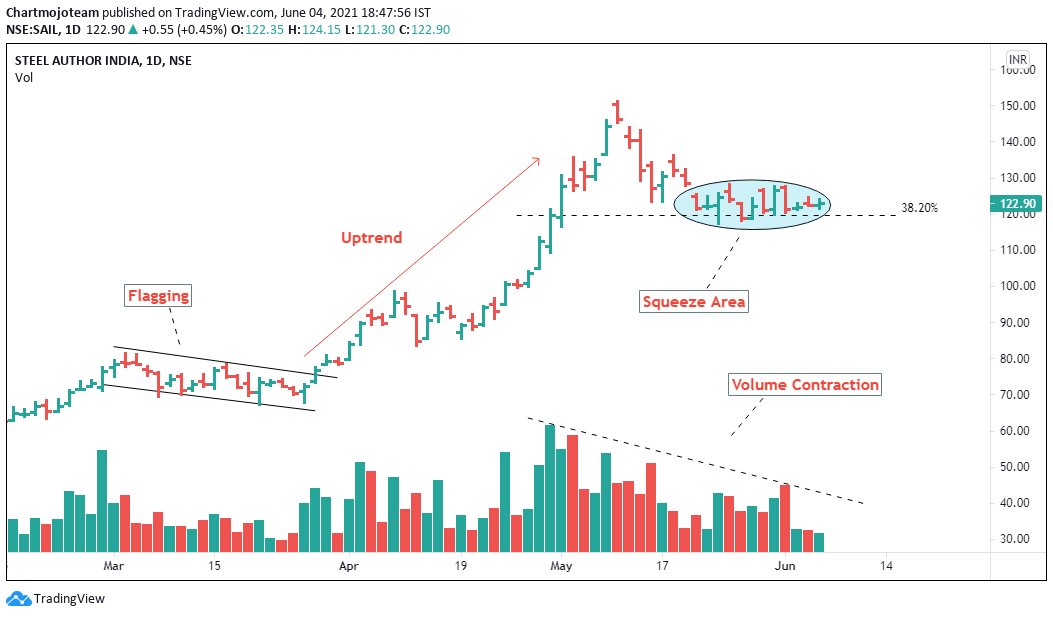
#SAIL
Long term chart!
Supports, resistances and channel top have been marked!
https://t.co/kYISxPZrC6
#AnalysisOnly #LongTerm #Investment
More from Nishant Kumar
More from Sail


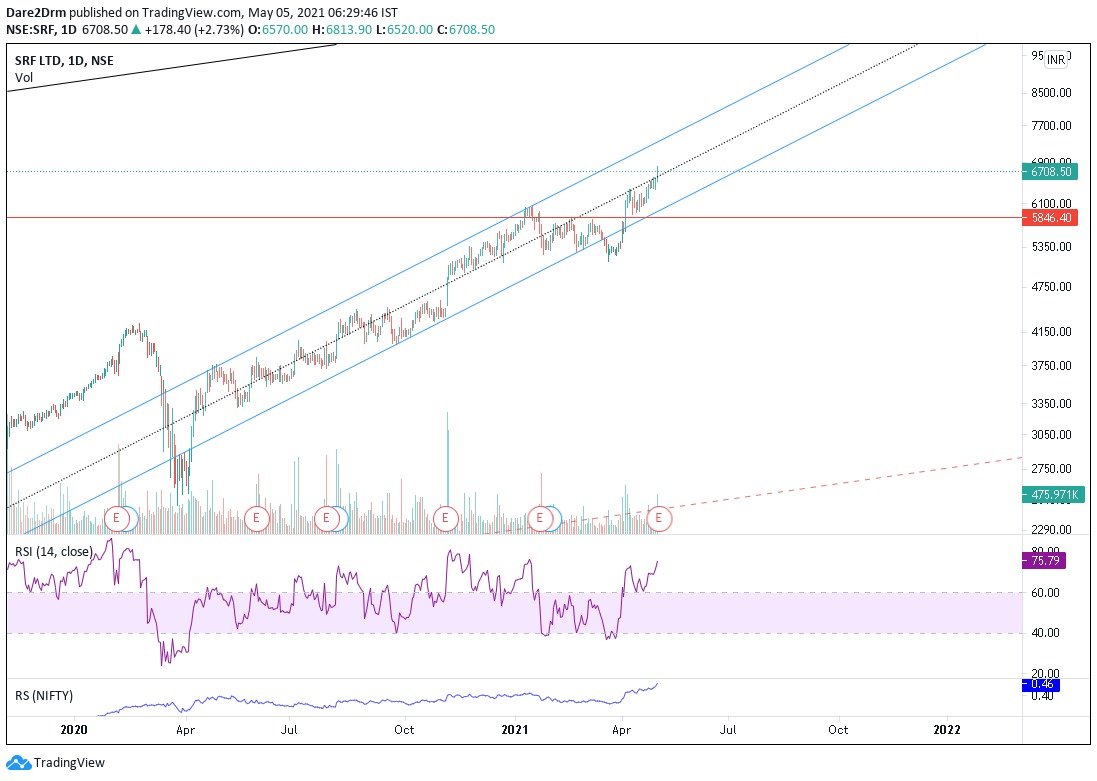
#SRF any similarity in chart pattern!? 🧐 Remember, this was my trigger from list of 3 stocks in watchlist.
Today, don't ask me for new watchlist - I will be mostly 'Watching' 😏 https://t.co/0BeDHtB55r
Today, don't ask me for new watchlist - I will be mostly 'Watching' 😏 https://t.co/0BeDHtB55r
#SAIL Directionally it is headed to 140/150 levels next over short period of time. SL - todays low pic.twitter.com/1IE4eJn9px
— Dare2Dream (@Dare2Dr10109801) April 13, 2021


You May Also Like


The first area to focus on is diversity. This has become a dogma in the tech world, and despite the fact that tech is one of the most meritocratic industries in the world, there are constant efforts to promote diversity at the expense of fairness, merit and competency. Examples:
USC's Interactive Media & Games Division cancels all-star panel that included top-tier game developers who were invited to share their experiences with students. Why? Because there were no women on the
ElectronConf is a conf which chooses presenters based on blind auditions; the identity, gender, and race of the speaker is not known to the selection team. The results of that merit-based approach was an all-male panel. So they cancelled the conference.
Apple's head of diversity (a black woman) got in trouble for promoting a vision of diversity that is at odds with contemporary progressive dogma. (She left the company shortly after this
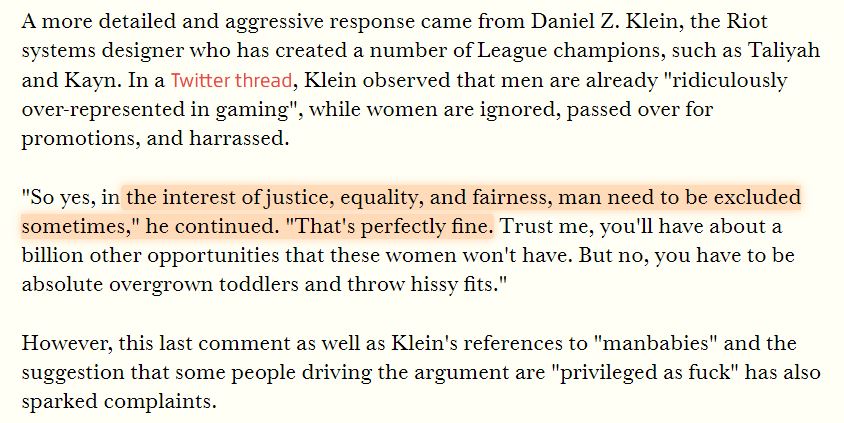
Also in the name of diversity, there is unabashed discrimination against men (especially white men) in tech, in both hiring policies and in other arenas. One such example is this, a developer workshop that specifically excluded men: https://t.co/N0SkH4hR35
USC's Interactive Media & Games Division cancels all-star panel that included top-tier game developers who were invited to share their experiences with students. Why? Because there were no women on the
ElectronConf is a conf which chooses presenters based on blind auditions; the identity, gender, and race of the speaker is not known to the selection team. The results of that merit-based approach was an all-male panel. So they cancelled the conference.
Apple's head of diversity (a black woman) got in trouble for promoting a vision of diversity that is at odds with contemporary progressive dogma. (She left the company shortly after this
Also in the name of diversity, there is unabashed discrimination against men (especially white men) in tech, in both hiring policies and in other arenas. One such example is this, a developer workshop that specifically excluded men: https://t.co/N0SkH4hR35

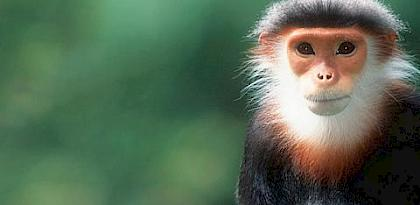
Tip from the Monkey
Pangolins, September 2019 and PLA are the key to this mystery
Stay Tuned!
1. Yang
2. A jacobin capuchin dangling a flagellin pangolin on a javelin while playing a mandolin and strangling a mannequin on a paladin's palanquin, said Saladin
More to come tomorrow!
3. Yigang Tong
https://t.co/CYtqYorhzH
Archived: https://t.co/ncz5ruwE2W
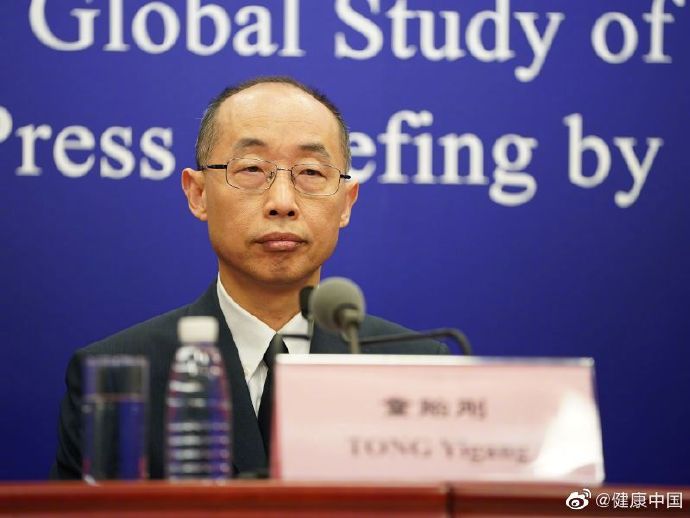
4. YT Interview
Some bats & pangolins carry viruses related with SARS-CoV-2, found in SE Asia and in Yunnan, & the pangolins carrying SARS-CoV-2 related viruses were smuggled from SE Asia, so there is a possibility that SARS-CoV-2 were coming from
Pangolins, September 2019 and PLA are the key to this mystery
Stay Tuned!
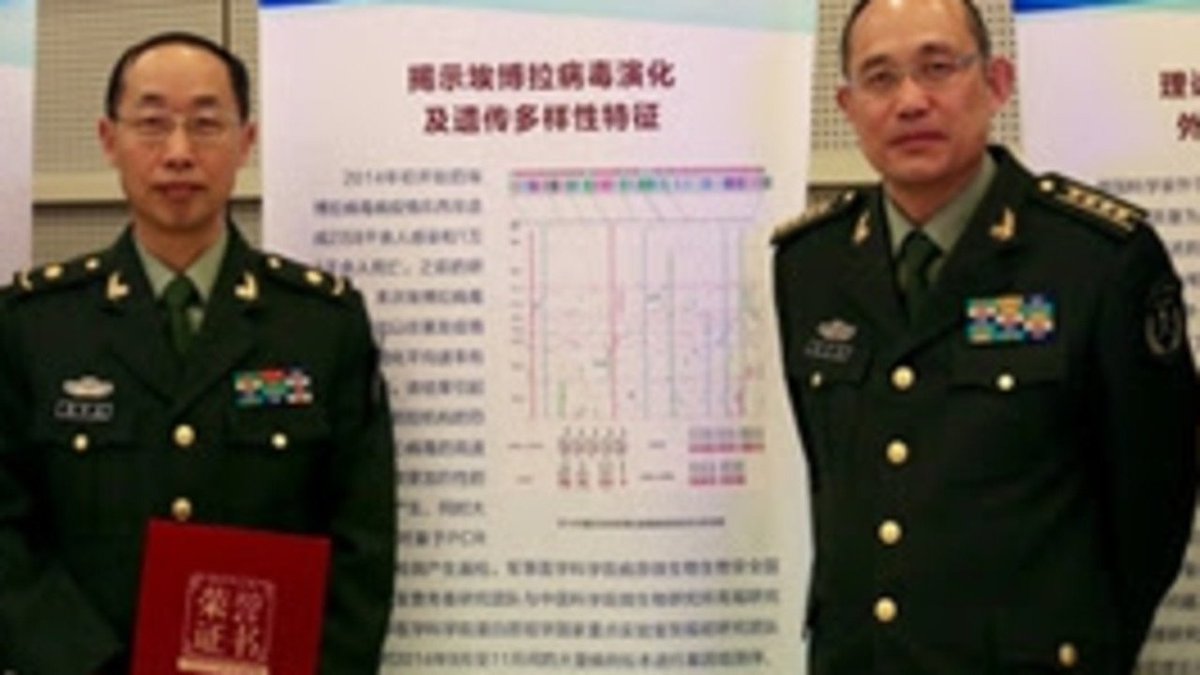
1. Yang
Meet Yang Ruifu, CCP's biological weapons expert https://t.co/JjB9TLEO95 via @Gnews202064
— Billy Bostickson \U0001f3f4\U0001f441&\U0001f441 \U0001f193 (@BillyBostickson) October 11, 2020
Interesting expose of China's top bioweapons expert who oversaw fake pangolin research
Paper 1: https://t.co/TrXESKLYmJ
Paper 2:https://t.co/9LSJTNCn3l
Pangolinhttps://t.co/2FUAzWyOcv pic.twitter.com/I2QMXgnkBJ
2. A jacobin capuchin dangling a flagellin pangolin on a javelin while playing a mandolin and strangling a mannequin on a paladin's palanquin, said Saladin
More to come tomorrow!
3. Yigang Tong
https://t.co/CYtqYorhzH
Archived: https://t.co/ncz5ruwE2W
4. YT Interview
Some bats & pangolins carry viruses related with SARS-CoV-2, found in SE Asia and in Yunnan, & the pangolins carrying SARS-CoV-2 related viruses were smuggled from SE Asia, so there is a possibility that SARS-CoV-2 were coming from

