We often hear that prediction in markets is a nasty game, but we don't really have to believe everything we read on social media. Do we? As long as you maintain good accuracy in your predictions, you will do absolutely great.
#CNXIT https://t.co/w3qedea7T6
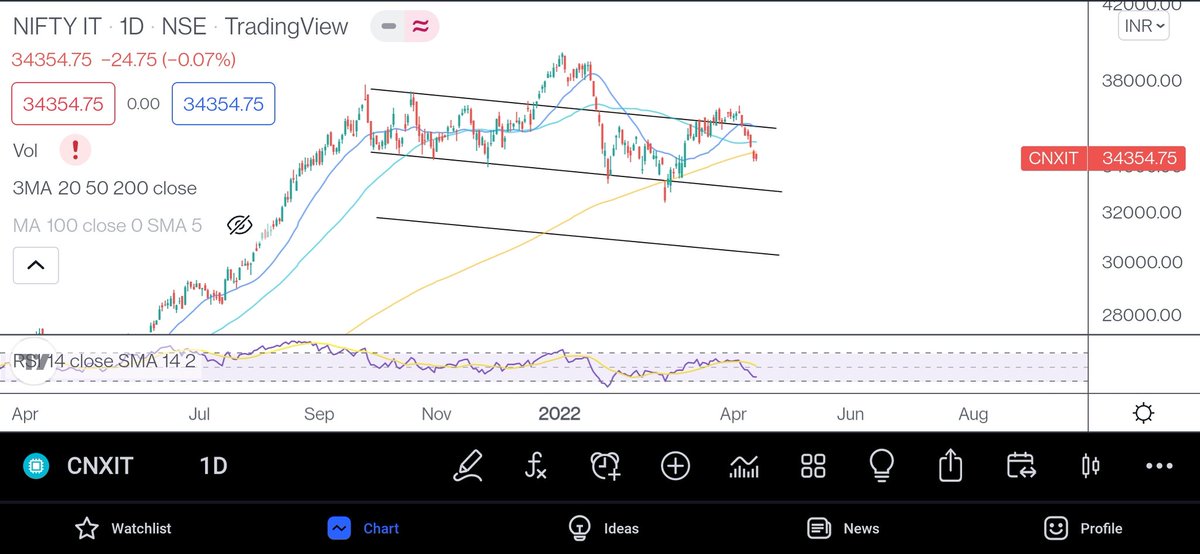
Almost there. Quick move. It can spend time over here before the next leg of fall. Let's see.#NIFTYIT https://t.co/GOB28HRvMp pic.twitter.com/6sNc7j8gEU
— Aakash Gangwar (@akashgngwr823) March 9, 2022
More from Aakash Gangwar
#KPITTECH https://t.co/qPLH3li2Yy
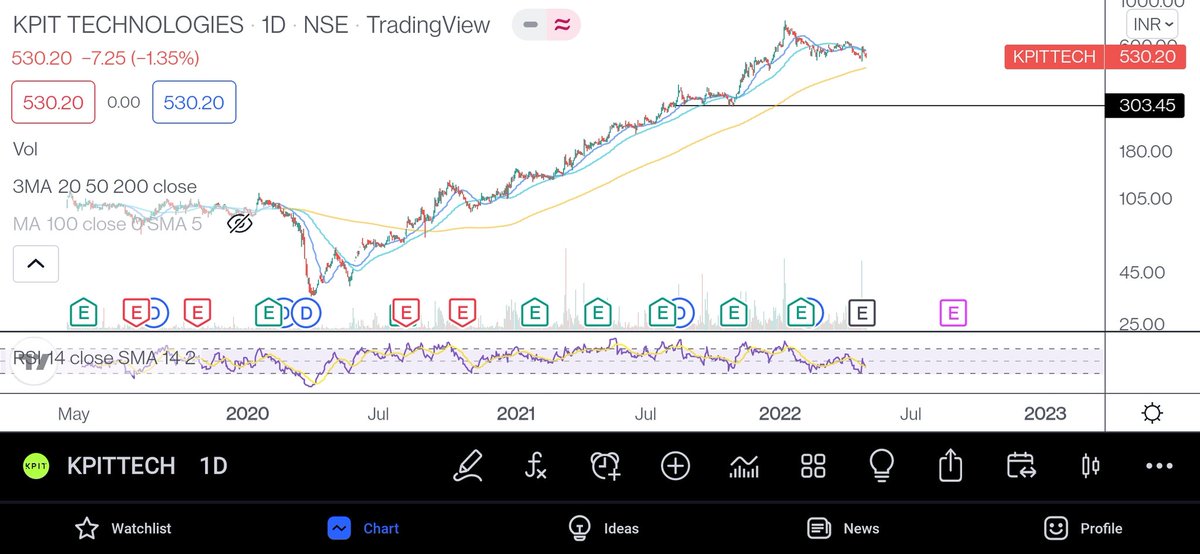
Charts for reference. During a downtrend, news based buying is an opportunity to make an exit in most of the cases. #KPITTECH #Hikal https://t.co/63WBMFZ6BT pic.twitter.com/OgWzulTXiD
— Aakash Gangwar (@akashgngwr823) April 27, 2022
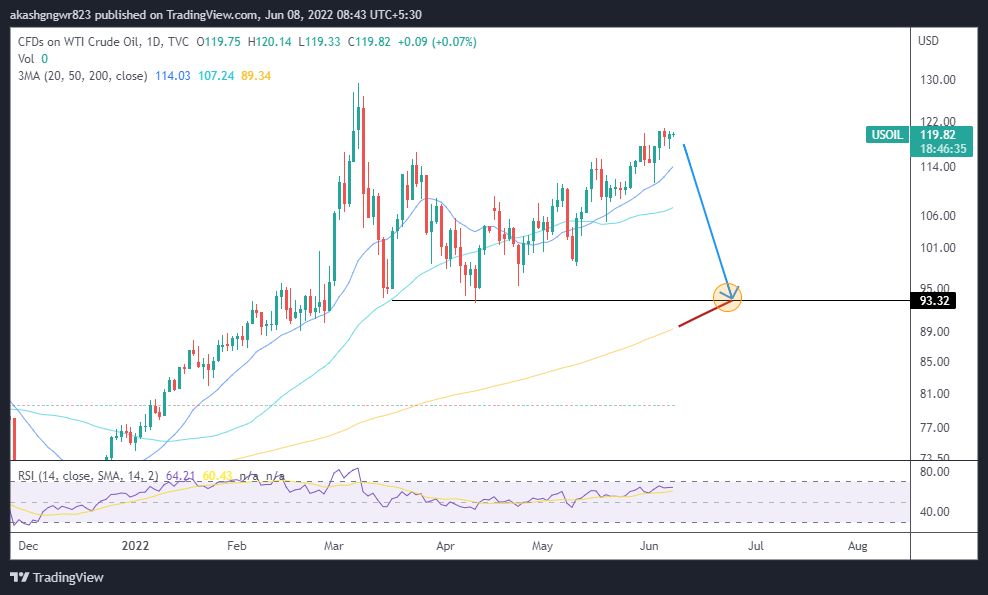
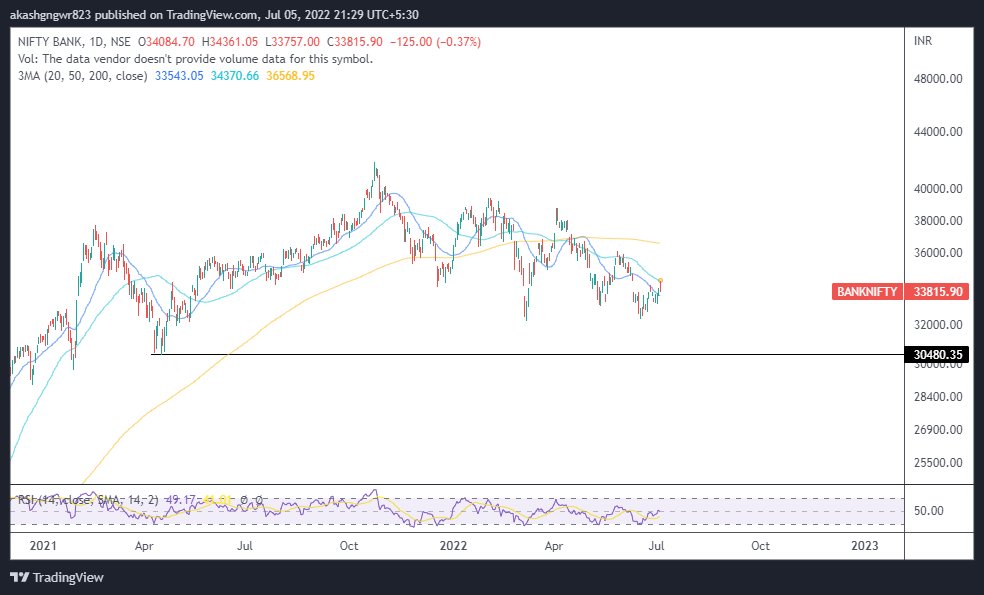
Do read it completely to understand the stance and the plan.
This thread will present a highly probable scenario of markets for the upcoming months. Will update the scenario too if there is a significant change in view in between.
— Aakash Gangwar (@akashgngwr823) May 15, 2022
1/n https://t.co/jfWOyEgZyd
1. The moving average structure - Many traders just look at the 200 ma test or closing above/below it regardless of its slope. Let's look at all the interactions with 200 ma where price met it for the first time after the trend change but with 200 ma slope against it
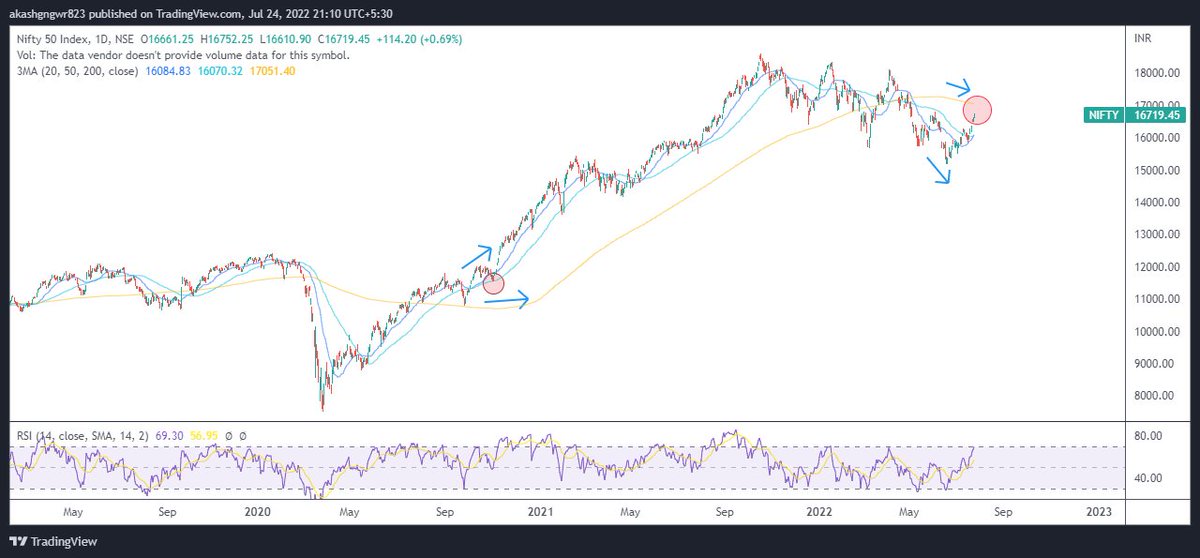
One can clearly sense that currently it is one of those scenarios only. I understand that I might get trolled for this, but an unbiased mind suggests that odds are highly against the bulls for making fresh investments.
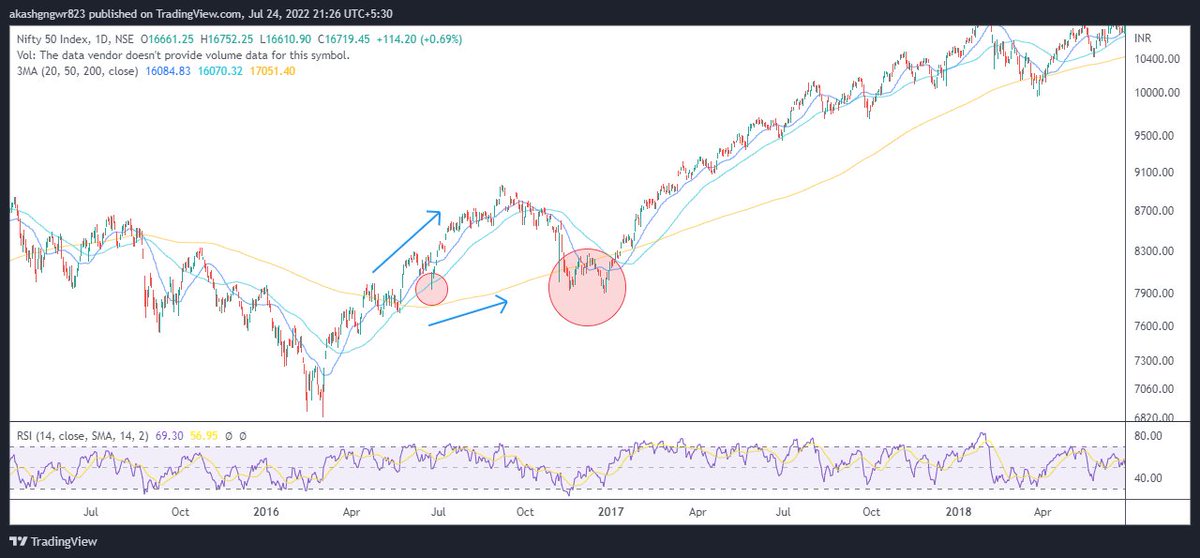
But markets are good at giving surprises. What should be our stance if price kept on rising? Let's understand that through charts. The concept is still the same. Divergent 200 ma and price move results in 200 ma test atleast once which gives good investment opportunities.
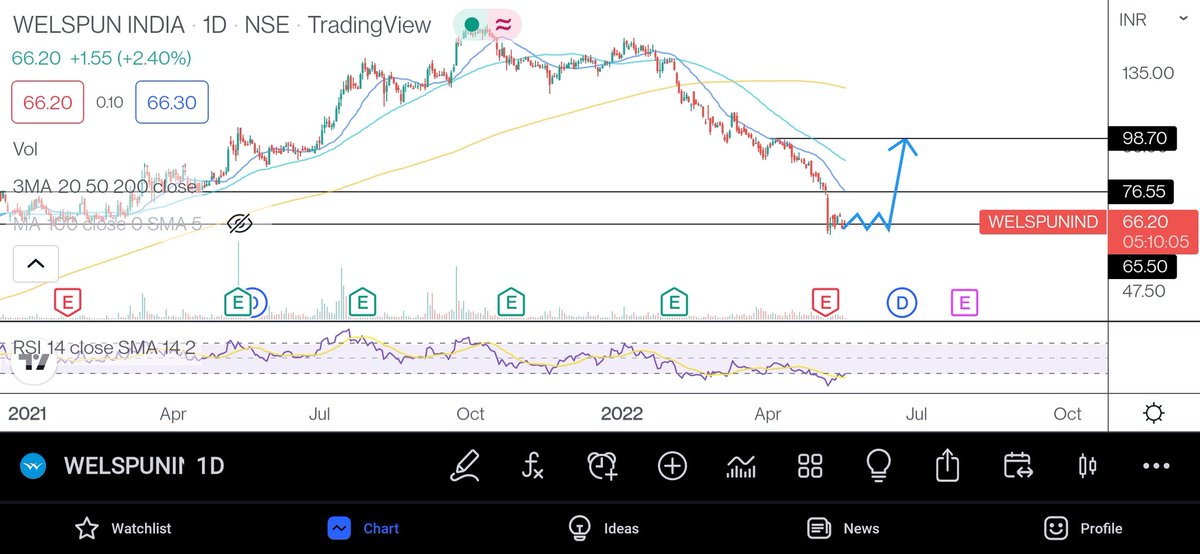
2. Zig-Zag bear market- There are two types of fall in a bear market, the first one is vertical fall which usually ends with ending diagonals (falling wedges) and the second one is zig zag one which usually ends with parabolic down moves.
More from Cnxitlongterm
#CNXIT https://t.co/bJeKTMoCji
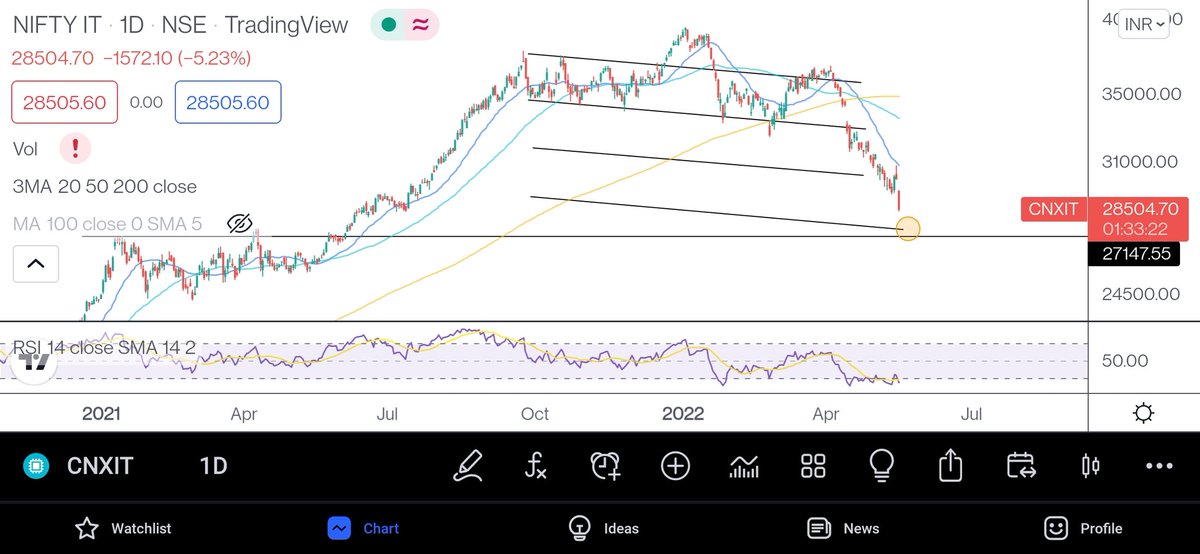
The current formation might look like a falling wedge, but the way moving averages are placed, it looks like a falling wedge which can lead to a parabolic downmove for the marked target. #CNXIT pic.twitter.com/GmXOI3HmUN
— Aakash Gangwar (@akashgngwr823) May 10, 2022

Weekly chart.
Each Fibonacci retracement level shown in #box likely to be tested in time to come.
#Perspective https://t.co/aDDZJV2KE3

#CNXIT-36442#NiFTY IT
— Waves_Perception(Dinesh Patel) \u092e\u0948\u0902Schedule Tribe) (@idineshptl) March 25, 2022
Weekly chart.
Objective is to creat lower top against ATH.(39446.70)
MACD showing negative divergence. Attract selling pressure in time to come.#Probability pic.twitter.com/hPx8SMpeoo

#CNXIT
Parabolic move has been triggered. Let's have 27k. That could be the buying zone for IT names. #CNXIT https://t.co/bJeKTMoCji pic.twitter.com/ab6w1mysz0
— Aakash Gangwar (@akashgngwr823) May 19, 2022