
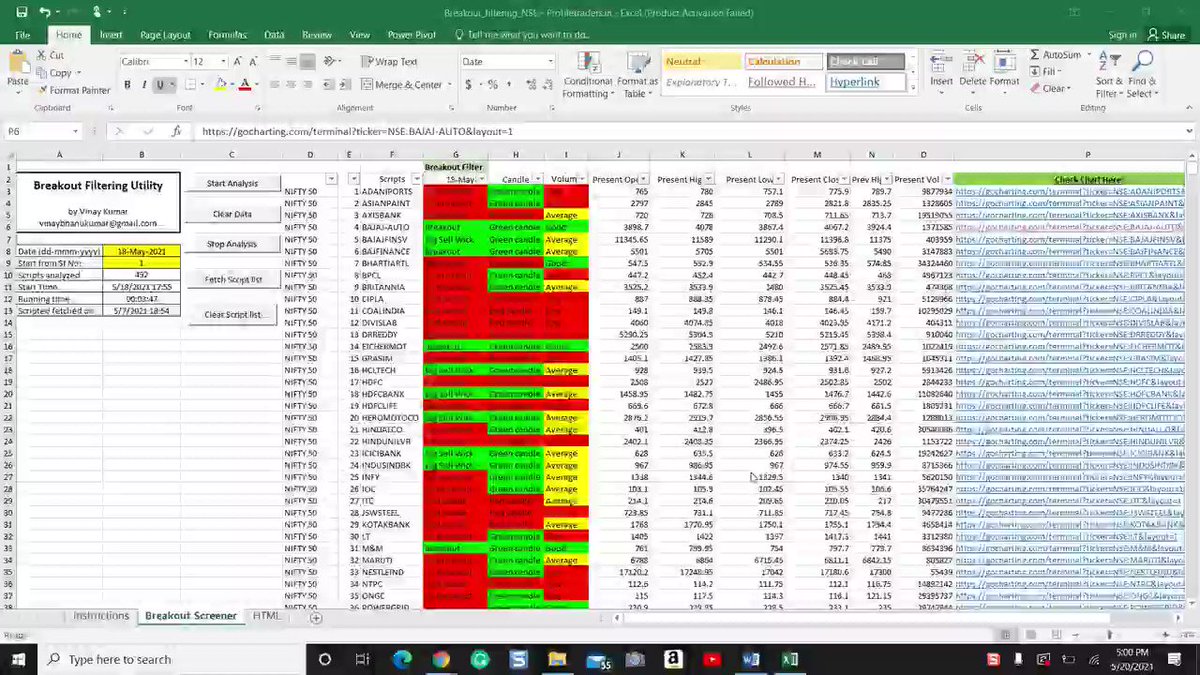
The best place to lose money in this world is Trading.
Trading is misunderstood!
I understand why — it’s a complex process with lots of conflicting advice.
Here’s the good news.
With a little effort & dedication, you can do better in
More from Indrazith Shantharaj


More from Bookstoread


You May Also Like


fascinated by this man, mario cortellucci, and his outsized influence on ontario and GTA politics. cortellucci, who lives in vaughan and ran as a far-right candidate for the italian senate back in 2018 - is a major ford donor...
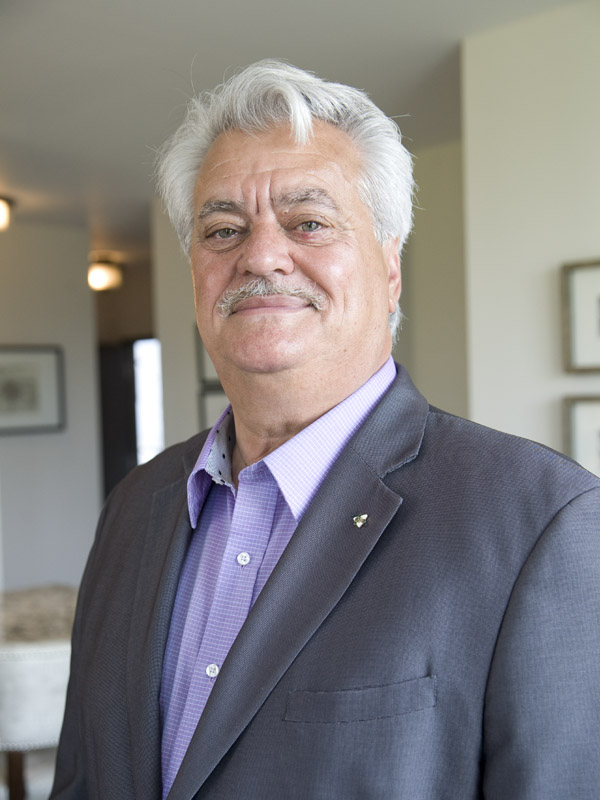
his name might sound familiar because the new cortellucci vaughan hospital at mackenzie health, the one doug ford has been touting lately as a covid-centric facility, is named after him and his family
but his name also pops up in a LOT of other ford projects. for instance - he controls the long term lease on big parts of toronto's portlands... where doug ford once proposed building an nfl stadium and monorail... https://t.co/weOMJ51bVF
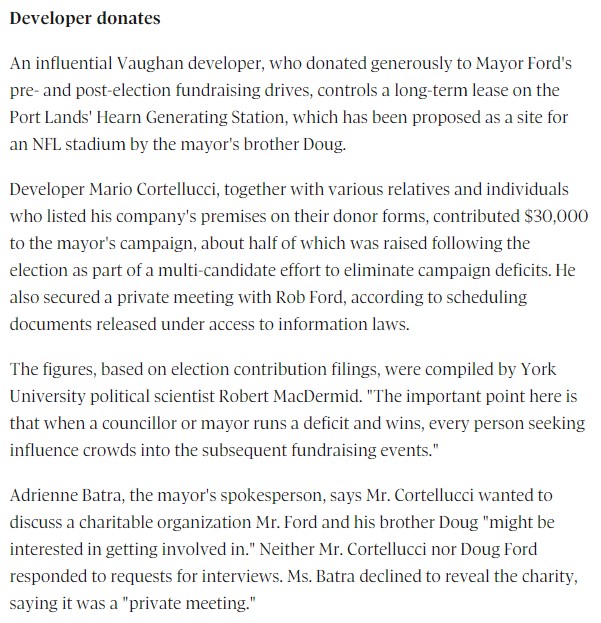
cortellucci, who is a developer, also owns a large chunk of the greenbelt. doug ford's desire to develop the greenbelt has been
and late last year he rolled back the mandate of conservation authorities there, prompting the resignations of several members of the greenbelt advisory
his name might sound familiar because the new cortellucci vaughan hospital at mackenzie health, the one doug ford has been touting lately as a covid-centric facility, is named after him and his family
but his name also pops up in a LOT of other ford projects. for instance - he controls the long term lease on big parts of toronto's portlands... where doug ford once proposed building an nfl stadium and monorail... https://t.co/weOMJ51bVF
cortellucci, who is a developer, also owns a large chunk of the greenbelt. doug ford's desire to develop the greenbelt has been
and late last year he rolled back the mandate of conservation authorities there, prompting the resignations of several members of the greenbelt advisory