*Heads-up that this thread will feature some extreme examples of homophobia and transphobia.*
Hey folks, have you ever wondered why trans people face constant accusations of fetishism, sexual predation and child abuse/grooming? Well, today let's talk about stochastic terrorism.
So, first we have to talk about what stochastic terrorism actually is. Remember when there was a conspiracy that there was a pedophile ring operating out of a pizza parlour basement, and a crazed gunman showed up? It's that sort of incitement that stochastic terrorism describes.
It's the demonisation or incitement against a group of people or individuals with the intent that other, unaffiliated parties will act upon it; it's the releasing doctored footage and a shooter show up at Planned Parenthood as a direct result of what he's been led to believe.
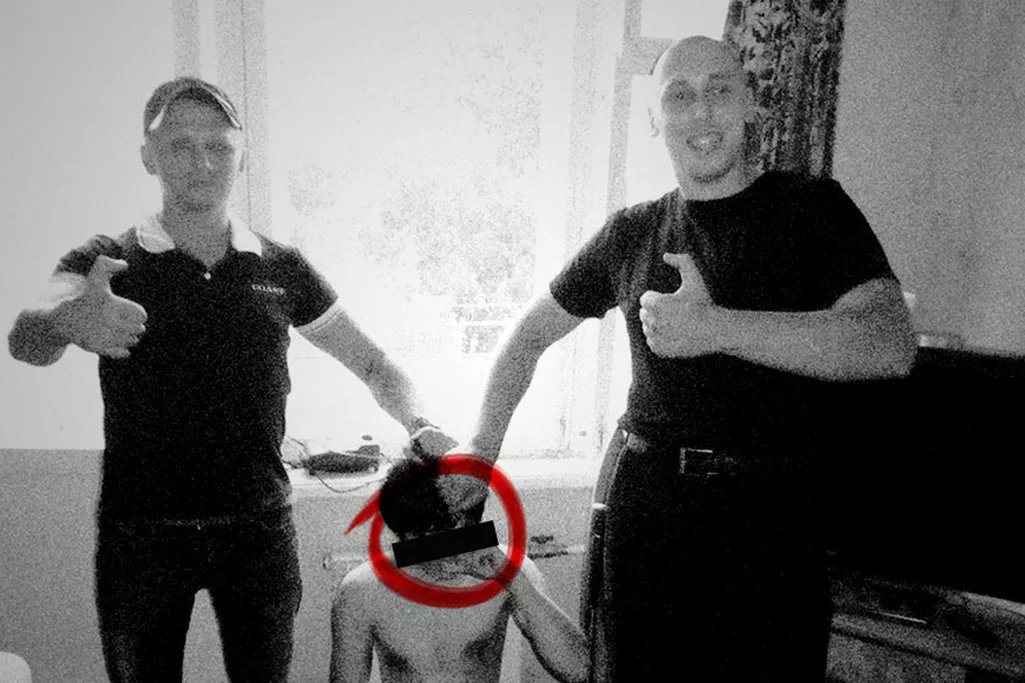
So with that in mind, let's talk about Russia's extreme anti-LGBT laws that banned the "promotion" of LGBT lifestyles to children. A move that specifically marked LGBT people as a threat to children, and resulted in neo-nazis meting out vigilante "justice" against gay men.
Groups such as this would lure unsuspecting gay men via dating sites, and brutalise and humiliate them on camera. They did so under the guise of combating child abusers, one group calling themselves "Occupy