#BHEL - Bhel can give good move - TradingView -
More from TradingView India 🇮🇳
More from Bhel

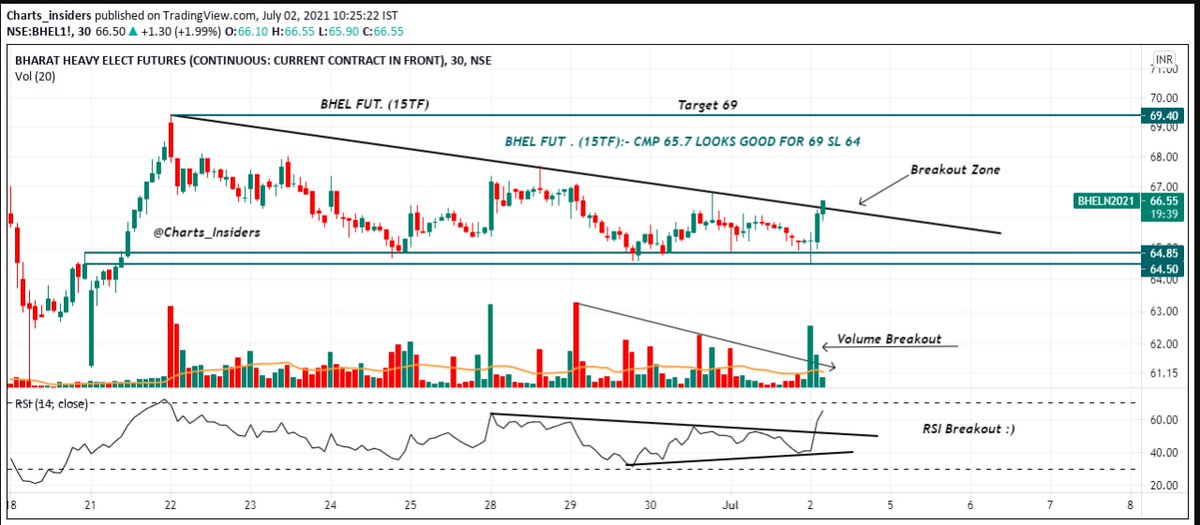


#Bhel up 5% since post
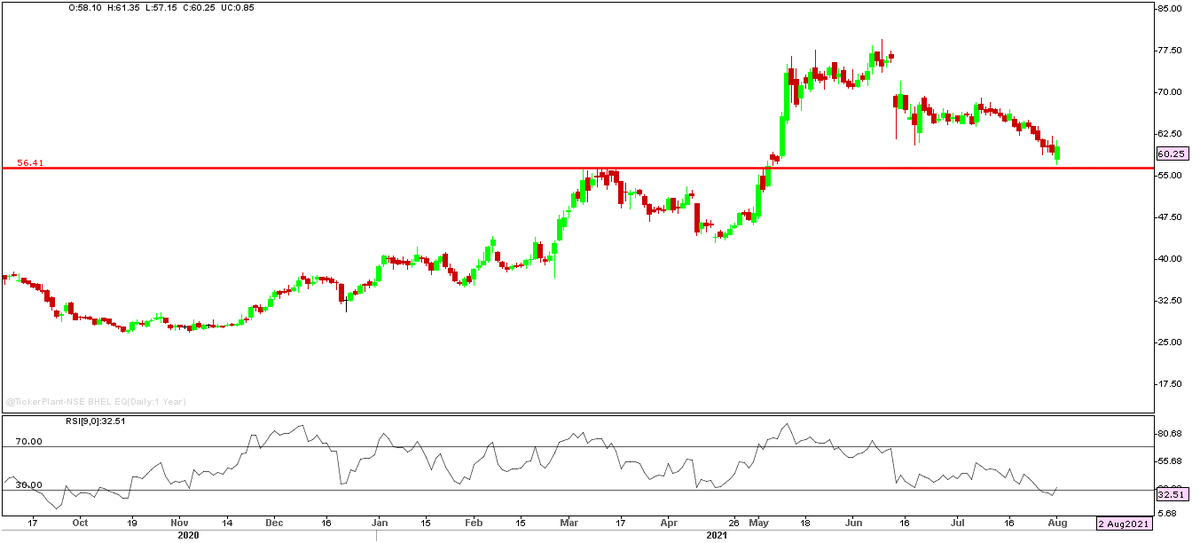
It crossed 63, now price action important, if sustains above 63, can possibly head towards 69-75 zone
RSI looking bullish
Not a trading call , academic post https://t.co/0IAjXZ5C88

It crossed 63, now price action important, if sustains above 63, can possibly head towards 69-75 zone
RSI looking bullish
Not a trading call , academic post https://t.co/0IAjXZ5C88
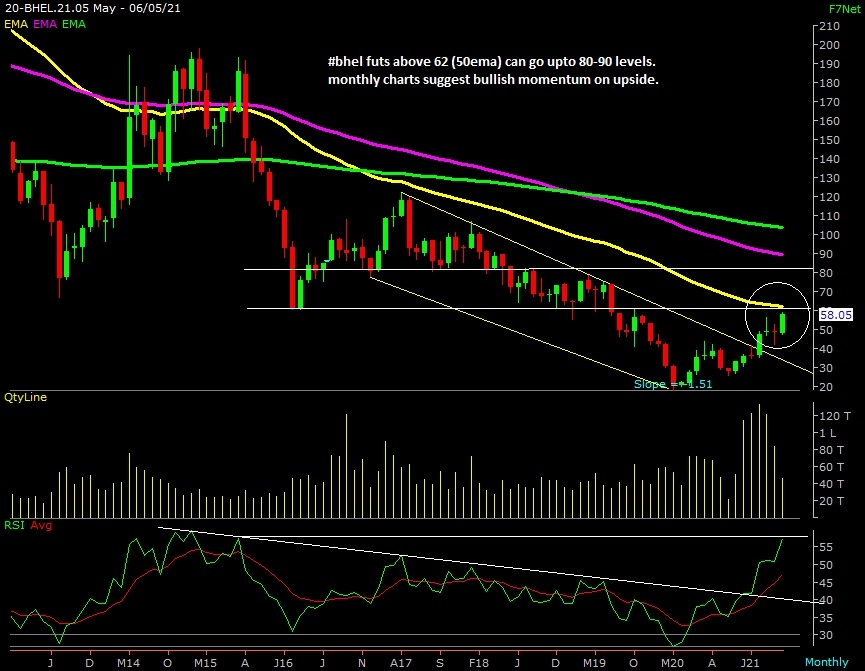
#BHEL monthly chart, if the stock is able to trade above 60-63 zone, we may see significant upmove in this stock, Monthly RSI is 50+ & moving up.
— Techno Prince (@Trader_souradep) May 10, 2021
Not a trading call, academic post pic.twitter.com/VuBoKJvbmn
You May Also Like

Nano Course On Python For Trading
==========================
Module 1
Python makes it very easy to analyze and visualize time series data when you’re a beginner. It's easier when you don't have to install python on your PC (that's why it's a nano course, you'll learn python...
... on the go). You will not be required to install python in your PC but you will be using an amazing python editor, Google Colab Visit https://t.co/EZt0agsdlV
This course is for anyone out there who is confused, frustrated, and just wants this python/finance thing to work!
In Module 1 of this Nano course, we will learn about :
# Using Google Colab
# Importing libraries
# Making a Random Time Series of Black Field Research Stock (fictional)
# Using Google Colab
Intro link is here on YT: https://t.co/MqMSDBaQri
Create a new Notebook at https://t.co/EZt0agsdlV and name it AnythingOfYourChoice.ipynb
You got your notebook ready and now the game is on!
You can add code in these cells and add as many cells as you want
# Importing Libraries
Imports are pretty standard, with a few exceptions.
For the most part, you can import your libraries by running the import.
Type this in the first cell you see. You need not worry about what each of these does, we will understand it later.