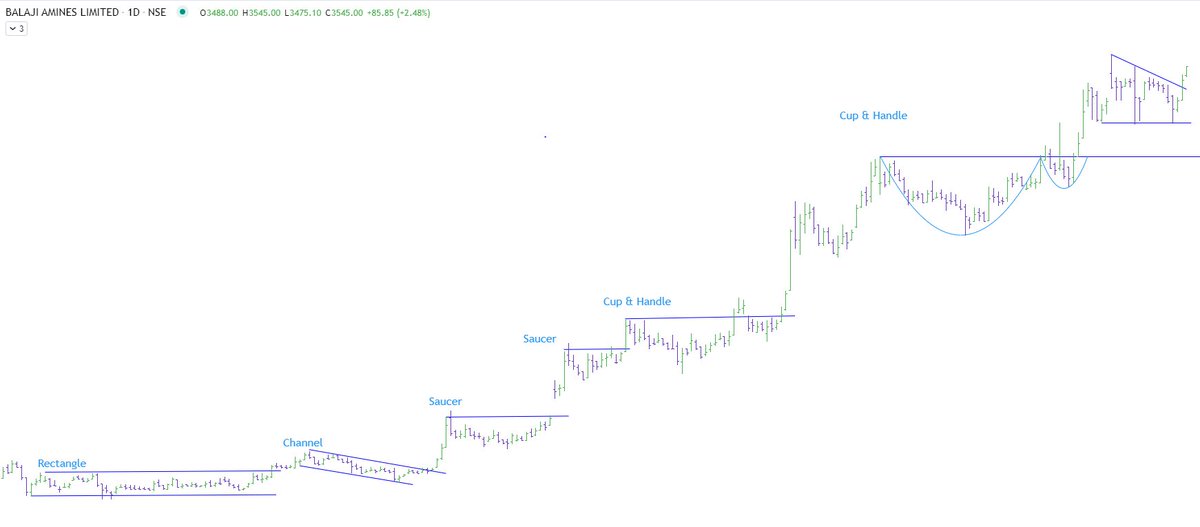
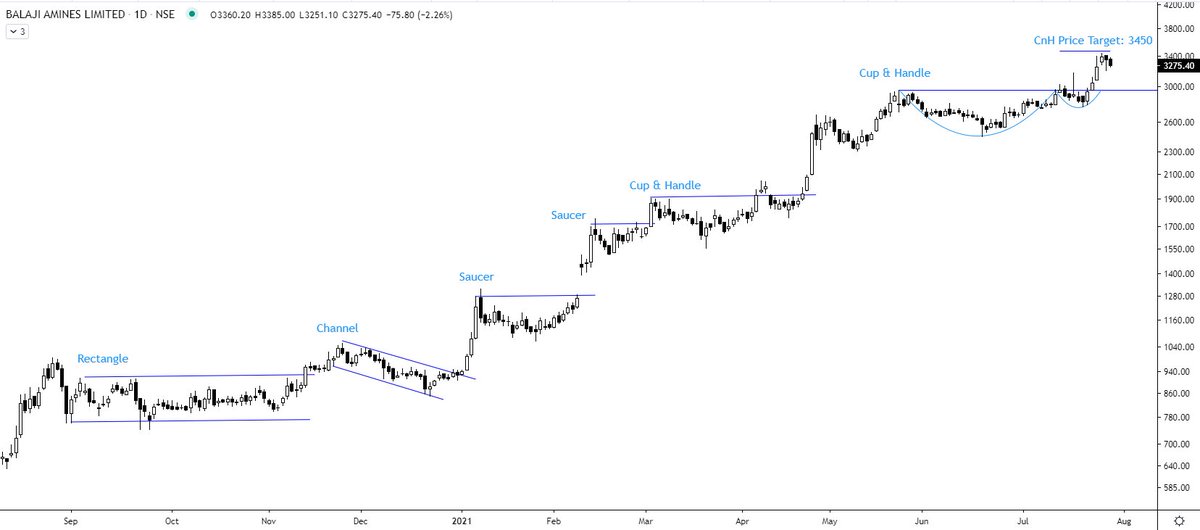
#Balamines has been a very bullish stock
RSI & MACD very bullish
Presently consolidating in a flag pattern
Volume has been very high off late
If the stock is able to sustain above 5220-5250 it may rally towards 6175 or higher
#Nifty #stocks
Not trading call, academic post

More from Techno Prince


More from Balajiamines


Bullish commentry by
#BalajiAmines
1800 CR Revenue guidelines in fy22 with 26% Margin
Still trade in discount compare to #AlkylAmines
#BalajiAmines
1800 CR Revenue guidelines in fy22 with 26% Margin
Still trade in discount compare to #AlkylAmines
#BalajiAmines\u2019 up 13% this week & over 300% this year so far. @_soniashenoy & @SurabhiUpadhyay speak to MD, D Ram Reddy who says that they will come up with the Acetonitrile plant next financial year. @sonalbhutra pic.twitter.com/7bGxfz8xiO
— CNBC-TV18 (@CNBCTV18News) August 27, 2021

You May Also Like


Nano Course On Python For Trading
==========================
Module 1
Python makes it very easy to analyze and visualize time series data when you’re a beginner. It's easier when you don't have to install python on your PC (that's why it's a nano course, you'll learn python...
... on the go). You will not be required to install python in your PC but you will be using an amazing python editor, Google Colab Visit https://t.co/EZt0agsdlV
This course is for anyone out there who is confused, frustrated, and just wants this python/finance thing to work!
In Module 1 of this Nano course, we will learn about :
# Using Google Colab
# Importing libraries
# Making a Random Time Series of Black Field Research Stock (fictional)
# Using Google Colab
Intro link is here on YT: https://t.co/MqMSDBaQri
Create a new Notebook at https://t.co/EZt0agsdlV and name it AnythingOfYourChoice.ipynb
You got your notebook ready and now the game is on!
You can add code in these cells and add as many cells as you want
# Importing Libraries
Imports are pretty standard, with a few exceptions.
For the most part, you can import your libraries by running the import.
Type this in the first cell you see. You need not worry about what each of these does, we will understand it later.