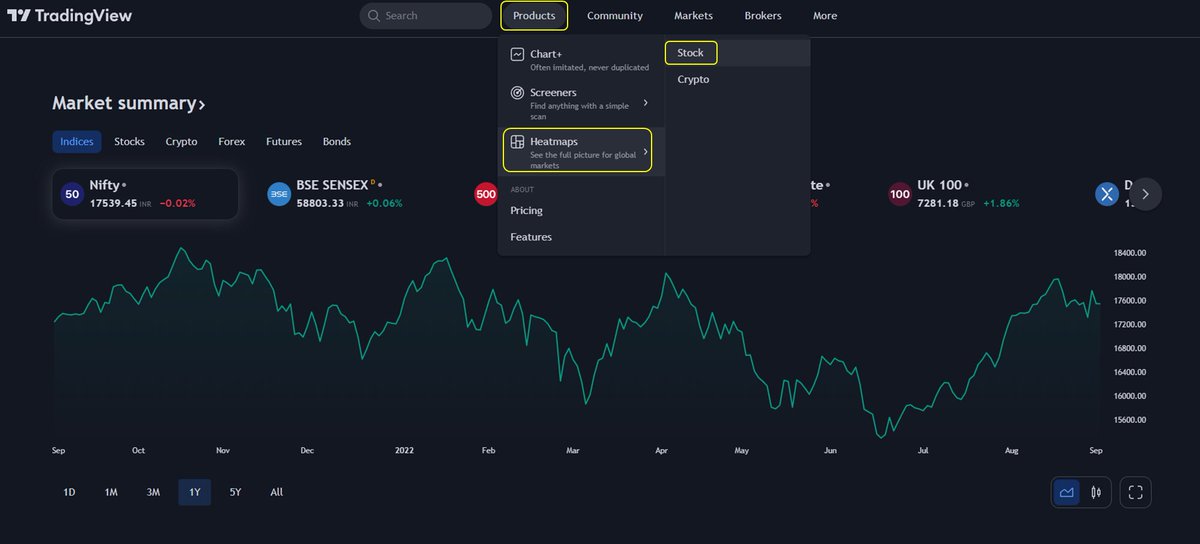
- It will show the heatmap of S&P 500 stocks
- So, you have to click on the 'S&P 500 index' in the top left corner and select one of the below,
NIFTY 50 index
All Indian companies
S&P BSE Sensex index
2/8
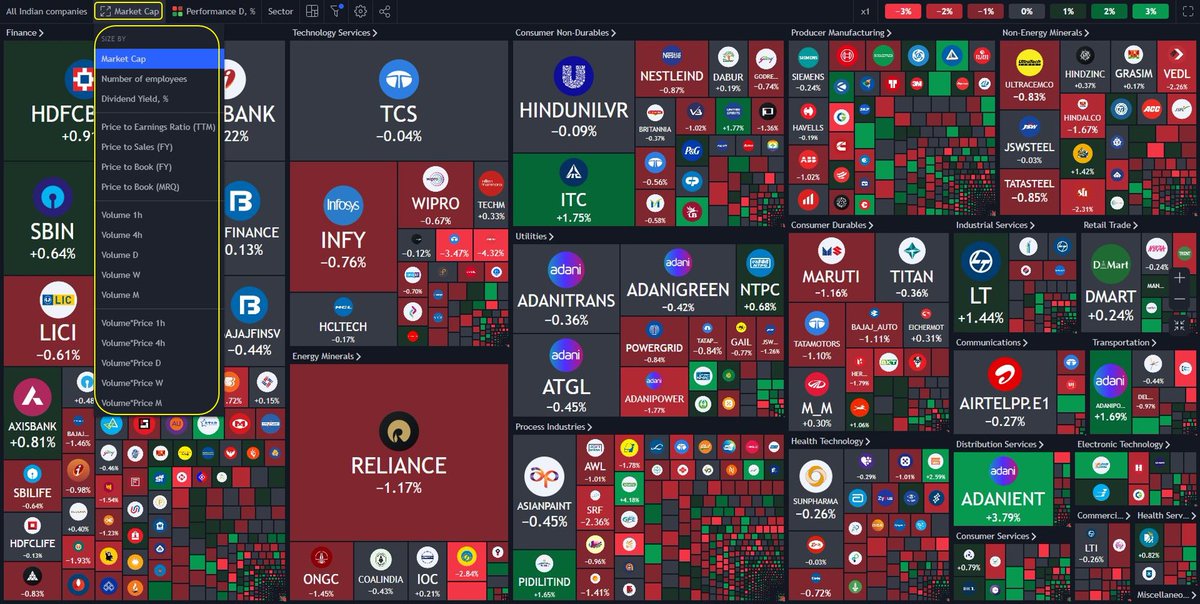
- I have selected 'All Indian companies'; you can see all companies listed in NSE & BSE in the heatmap
- The cell size of companies is based on their Market Capital
- Companies with higher Market Capital will have a bigger cell size
- Companies are segregated sector-wise
3/8
- Cell size can be modified depending on P/E, P/B, Dividend, Volume etc. in their respective sectors
- The colour of these cells denotes the daily performance of stocks
- You can try other options in the 'Performance' tab like Hourly, Weekly, Monthly etc.
4/8
- If these uneven-sized cells disturb your eyes, you can toggle to the mono-sized cells
- Cells of all stocks in a particular sector will have the same size
5/8
- If any sector catches your eye, you can click on the sector name and take a closed look at each stock in that sector
- Here, I can see a lot of green cells in the 'Consumer Services' sector
- So, I will go inside and see if I get anything.
& That's how it looks!
6/8
- In the top right corner, you can change the 'Heat Multiplier'
- By default it is 'x1' i.e. -3% to +3%
- I have changed it to 'x2' i.e. -6% to +6%
- Here, I want to see the stocks that moved more than 5.5%.
- So, I have deselected -6, -4, -2, 0, 2, 4 and kept 6 only
7/8
- Hereafter, I can go and study charts of the strong stocks by clicking on the respective cell
- MHRIL: 284
I can see that the above stock has given a breakout above the 52-week high
8/8