
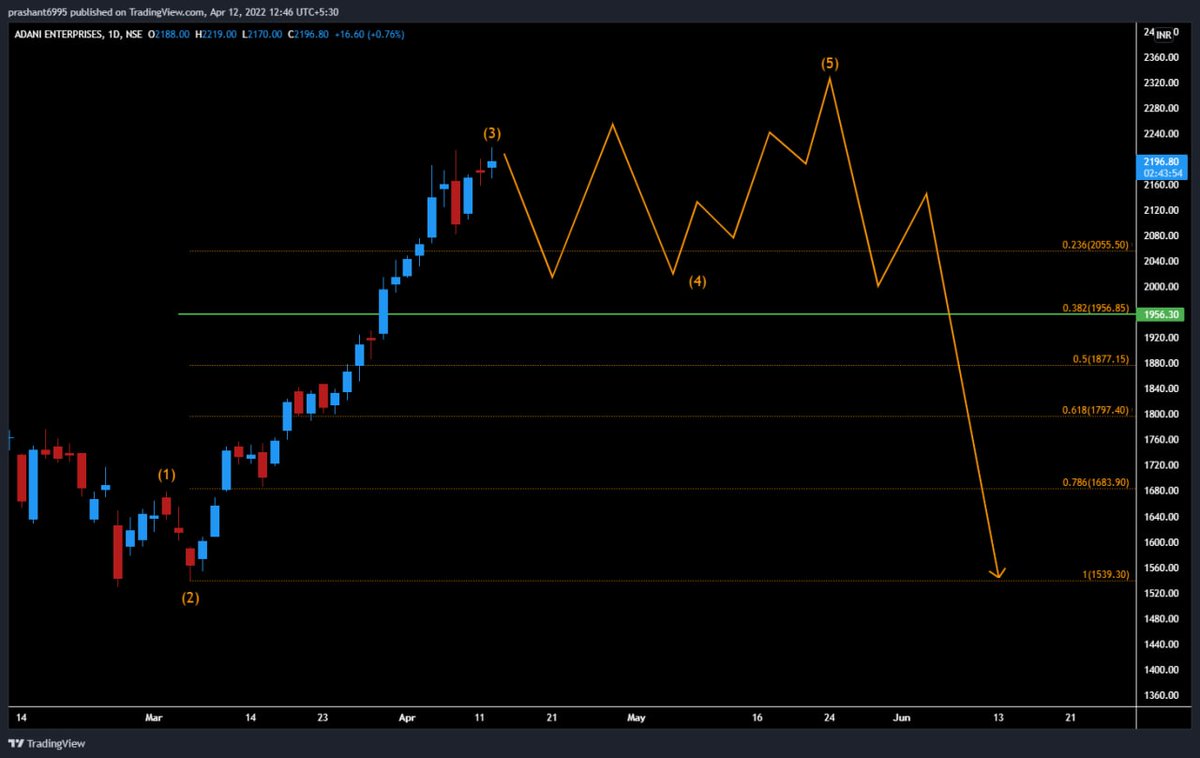
#AdaniEnt
#ElliottWaves
5 waves from March 2020 lows seem done now. Price confirmation is there.
Had a target of 2320+ for final wave 5.5 minimum and then head back to 1600 sub (we did 2420)
Now can head back to 1540 wave (4) low atleast.
More from Prashant Bhansali
1. Type the code of these two scripts exactly as shown in TV without any space and use NSE before it
NSE:MARUTI/NSE:CNXAUTO
2. Press enter
(10) Ratio chart (daily) of Auto Index/Nifty
— Prashant Bhansali (@prashant280294) June 5, 2021
Taking multiple support at crucial level
Autos could start outperformance over nifty as long the support holds , and more fiercely once resistance breached #PB365 pic.twitter.com/ZRSmtGH1ic
@Digital_Baba


You May Also Like

Decoded his way of analysis/logics for everyone to easily understand.
Have covered:
1. Analysis of volatility, how to foresee/signs.
2. Workbook
3. When to sell options
4. Diff category of days
5. How movement of option prices tell us what will happen
1. Keeps following volatility super closely.
Makes 7-8 different strategies to give him a sense of what's going on.
Whichever gives highest profit he trades in.
I am quite different from your style. I follow the market's volatility very closely. I have mock positions in 7-8 different strategies which allows me to stay connected. Whichever gives best profit is usually the one i trade in.
— Sarang Sood (@SarangSood) August 13, 2019
2. Theta falls when market moves.
Falls where market is headed towards not on our original position.
Anilji most of the time these days Theta only falls when market moves. So the Theta actually falls where market has moved to, not where our position was in the first place. By shifting we can come close to capturing the Theta fall but not always.
— Sarang Sood (@SarangSood) June 24, 2019
3. If you're an options seller then sell only when volatility is dropping, there is a high probability of you making the right trade and getting profit as a result
He believes in a market operator, if market mover sells volatility Sarang Sir joins him.
This week has been great so far. The main aim is to be in the right side of the volatility, rest the market will reward.
— Sarang Sood (@SarangSood) July 3, 2019
4. Theta decay vs Fall in vega
Sell when Vega is falling rather than for theta decay. You won't be trapped and higher probability of making profit.
There is a difference between theta decay & fall in vega. Decay is certain but there is no guaranteed profit as delta moves can increase cost. Fall in vega on the other hand is backed by a powerful force that sells options and gives handsome returns. Our job is to identify them.
— Sarang Sood (@SarangSood) February 12, 2020


Just added Telegram links to https://t.co/lDdqjtKTZL too! Now you can provide a nice easy way for people to message you :)

Less than 1 hour since I started adding stuff to https://t.co/lDdqjtKTZL again, and profile pages are now responsive!!! 🥳 Check it out -> https://t.co/fVkEL4fu0L

Accounts page is now also responsive!! 📱✨

💪 I managed to make the whole site responsive in about an hour. On my roadmap I had it down as 4-5 hours!!! 🤘🤠🤘

This New York Times feature shows China with a Gini Index of less than 30, which would make it more equal than Canada, France, or the Netherlands. https://t.co/g3Sv6DZTDE
That's weird. Income inequality in China is legendary.
Let's check this number.
2/The New York Times cites the World Bank's recent report, "Fair Progress? Economic Mobility across Generations Around the World".
The report is available here:
3/The World Bank report has a graph in which it appears to show the same value for China's Gini - under 0.3.
The graph cites the World Development Indicators as its source for the income inequality data.

4/The World Development Indicators are available at the World Bank's website.
Here's the Gini index: https://t.co/MvylQzpX6A
It looks as if the latest estimate for China's Gini is 42.2.
That estimate is from 2012.
5/A Gini of 42.2 would put China in the same neighborhood as the U.S., whose Gini was estimated at 41 in 2013.
I can't find the <30 number anywhere. The only other estimate in the tables for China is from 2008, when it was estimated at 42.8.