SAnngeri's Categories
SAnngeri's Authors


Latest Saves


What does it mean?
7 tweets that will teach you about its basics (and much more):🧵
Collaborated with @niki_poojary
1/ What is CPR?
The basics of CPR, how it's calculated, and TC and BC in CPR.
User: @ZerodhaVarsity.
One can also gauge the trend whether bullish or bearish.
Explained in very simple words
@ZerodhaVarsity 2/ What are the Uses of CPR?
User: @YMehta_
A thread that provides examples along with the concept.
Also includes an Intraday Trading Setup on 5 min
#CPR is an indicator which is used for #Intraday in Stock Market.
— Yash Mehta (@YMehta_) November 19, 2021
This learning thread would be on
"\U0001d650\U0001d668\U0001d65a\U0001d668 \U0001d664\U0001d65b \U0001d63e\U0001d64b\U0001d64d"
Like\u2764\ufe0f& Retweet\U0001f501for wider reach and for more such learning thread in the future.
Also, an investment strategy is shared using CPR in the end.
1/24
@ZerodhaVarsity @YMehta_ 3/ How to analyze trends with CPR?
User: @cprbykgs
How to interpret CPR based on the candles forming either above or below the daily and weekly CPR.
He is the most famous guy when it comes to CPR, so go through his Twitter and Youtube
CPR indicator trend analysis:
— Gomathi Shankar (@cprbykgs) January 25, 2022
Candles below daily & weekly CPR \U0001f43b
Candles above daily CPR but below weekly CPR early confirmation of \U0001f402
Candles above daily + weekly CPR strong confirmation of \U0001f402
Isn\u2019t it simple?#cprbykgs #cprindicator #nifty #banknifty
@ZerodhaVarsity @YMehta_ @cprbykgs 4/ Interpreting longer timeframes with CPR
User: @cprbykgs
Trend Reversals with CPR when the trend is bullish and it enters the daily CPR
#banknifty
— Gomathi Shankar (@cprbykgs) July 9, 2021
Candles above monthly CPR- Bullish
Candles above weekly CPR- Bullish
Now, whenever candles enter daily CPR range it indicates weakness of current trend & early signs of trend reversal.
So, wait for the candles to exit the daily CPR range then take the trade. (1/4) pic.twitter.com/7vaaLMCrV8

A bullish flag pattern right after the breakout. Although the broader rectangle target of 1190 is way more than this bullish flag target https://t.co/wdAzb7SS7L
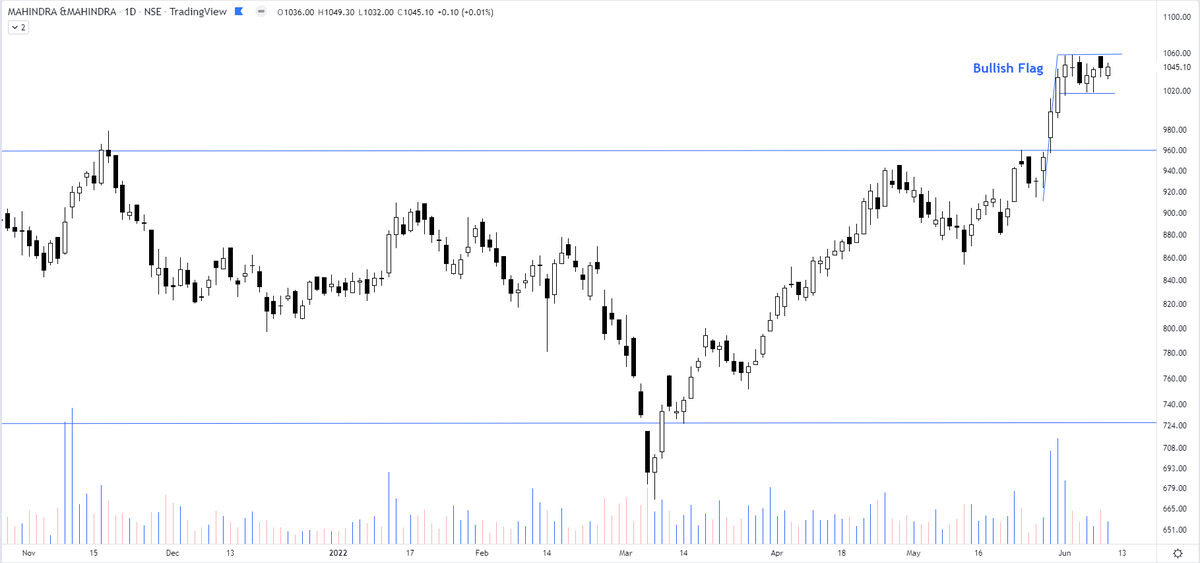
Interesting chart of Mahindra & Mahindra consolidating in a rectangle pattern & the price not falling back to the lower support. pic.twitter.com/GJ7rCfkB9f
— The_Chartist \U0001f4c8 (@charts_zone) May 26, 2022


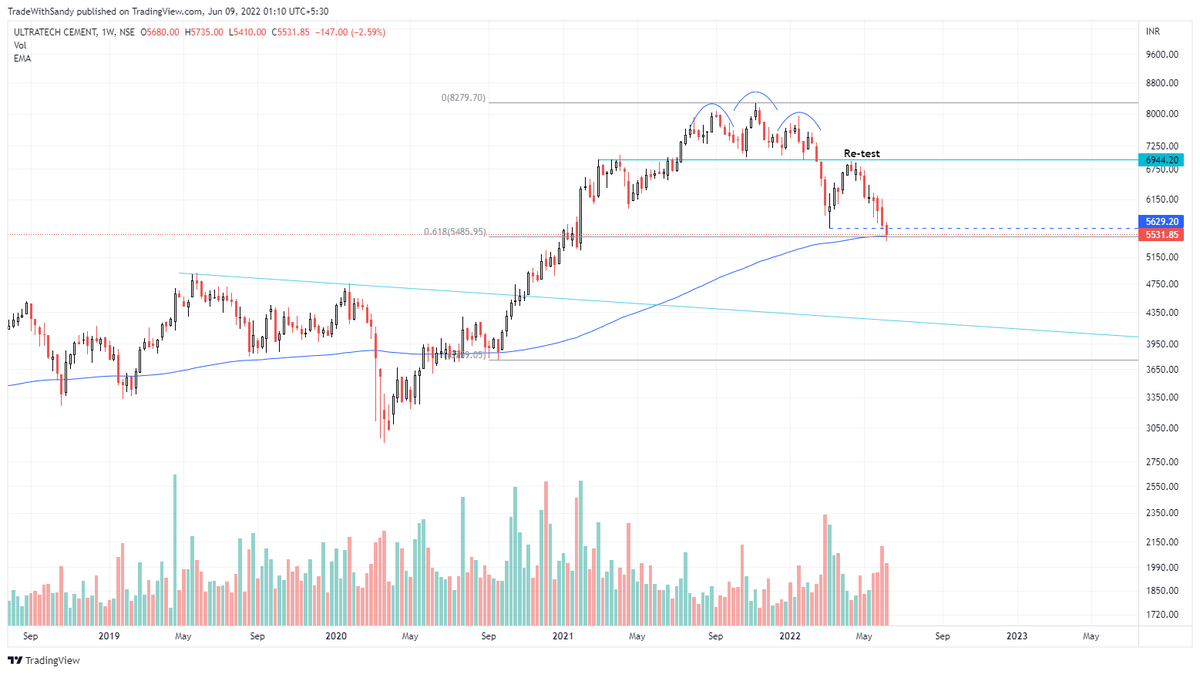
Cement companies are now is good buying zone for long term investors. Downside may not be more than 10-15% at max. Valuations extremely attractive.
— Sandeep Kulkarni (@moneyworks4u_fa) June 8, 2022
As far as I remember cement business has always been a cartel for atleast past 20 yrs.

This knowledge can change your PnL by huge as you know when to enter big & when to be careful & start booking profit
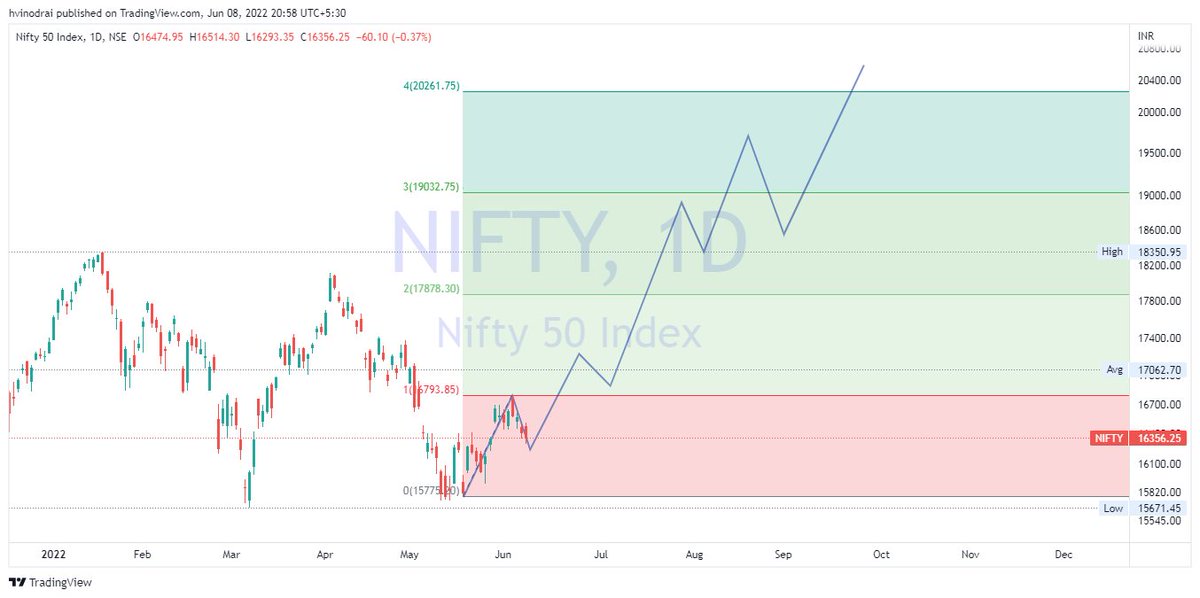
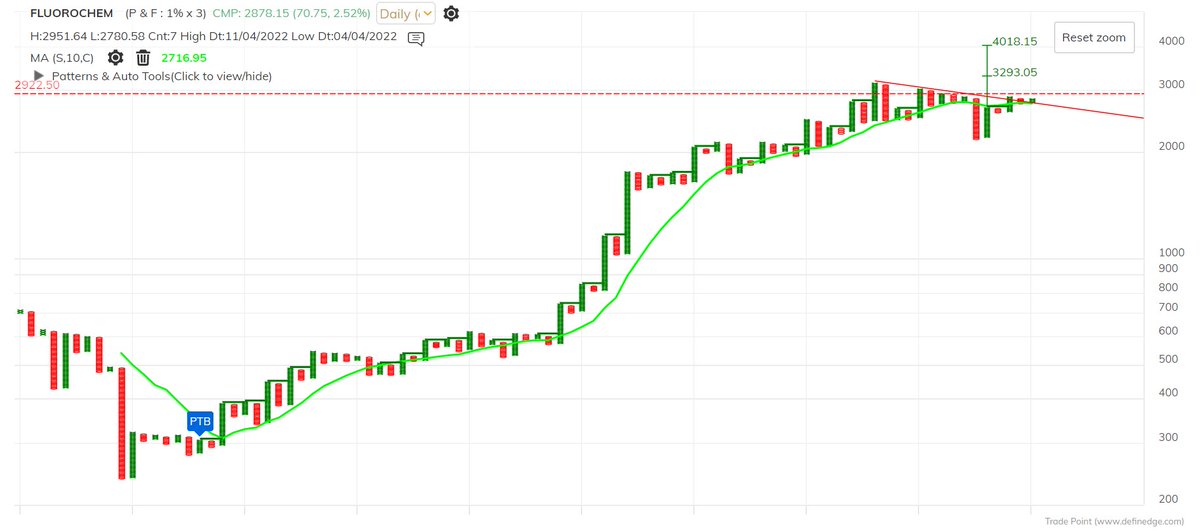
If we see last 4 bull run all went on avg 14 month after the Breakout (1/2) https://t.co/bsILTbAAwx
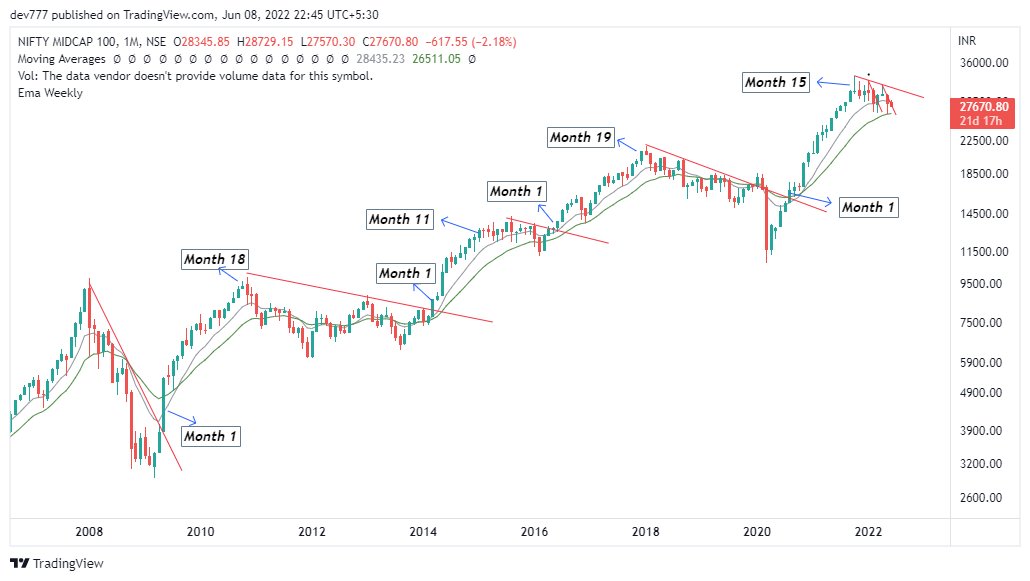
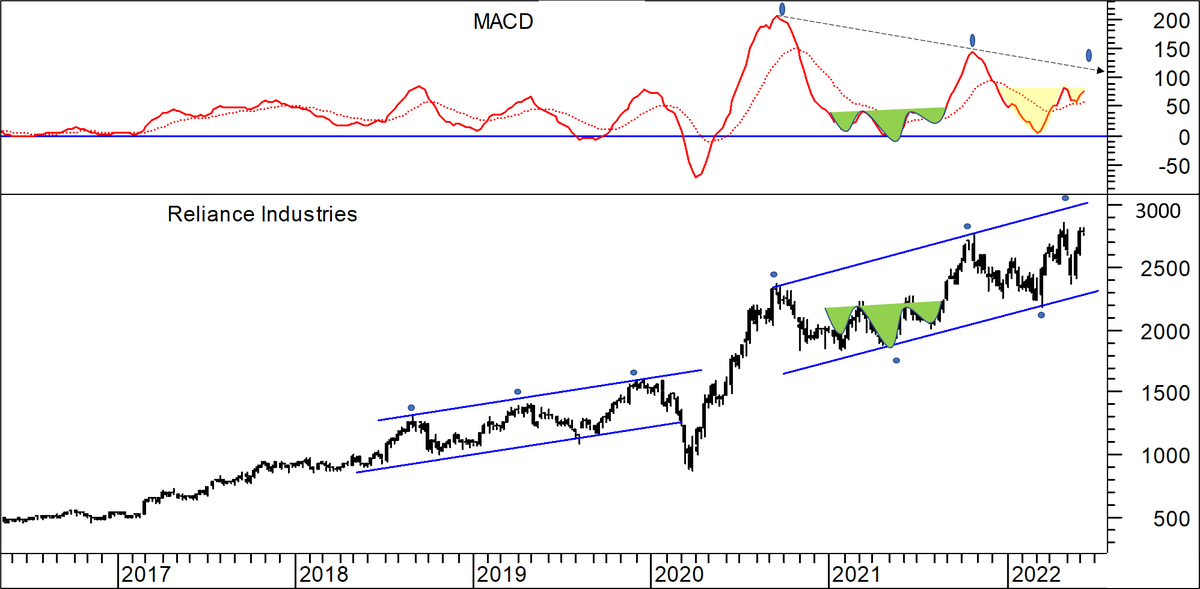
A backtesting of trends on monthly says - Good trends last 10-12 months on average after that they retest 20 EMA on monthly and sets up larger base
— EquiAlpha -MidTerm Momentum\U0001f40e\U0001f40e (@equialpha) June 8, 2022
You can use this to measure trends.. 3 examples for reference
1) FSl
2) Deepak NItrite
3) Balaji amines
4) Indiamart
(1/2) pic.twitter.com/FxUZmjPGNL
Don't know how many will get this as this is advance thing to get..Knowing this sets you objective before hand. Example if you are already in 11 th month of bull run you know you have to trail the trend a bit tight & if month 3 you know loads of money are waiting
Amazing