Each candle on any TF or any market forms this way. It doesn't matter whether this is a Monthly candle or a 1-minute candle
Each candle will have its own OHLC data.
Each candle starts with "O", then shapes "H" and "L" and ends with "C"


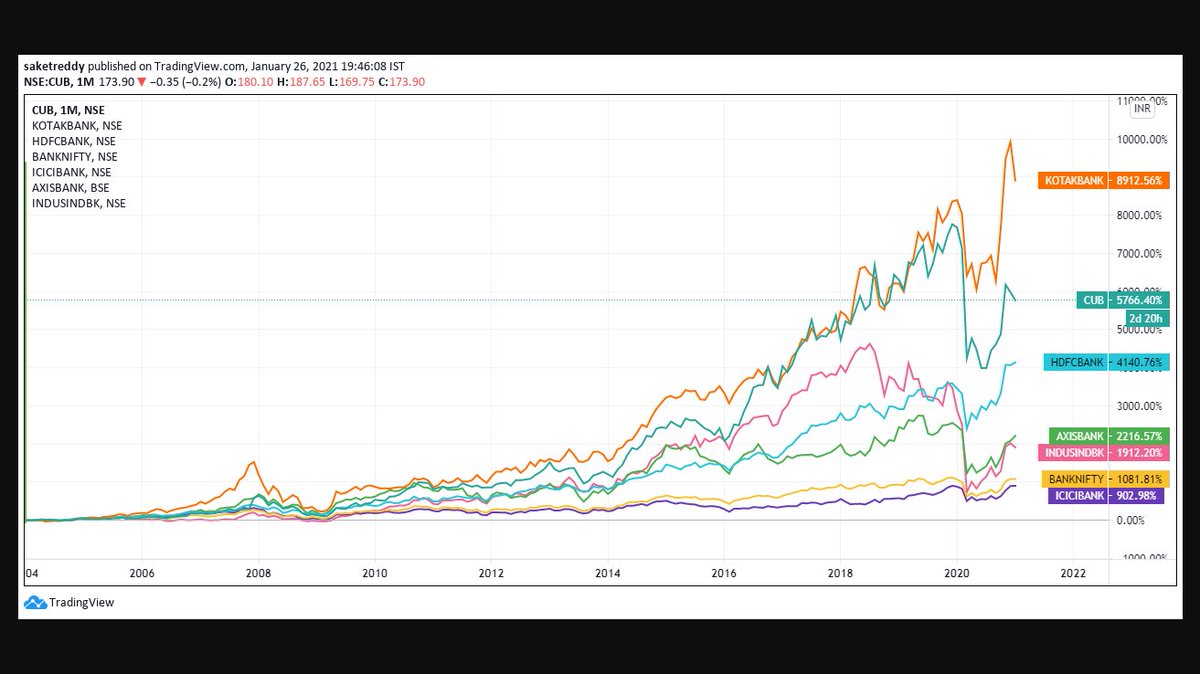
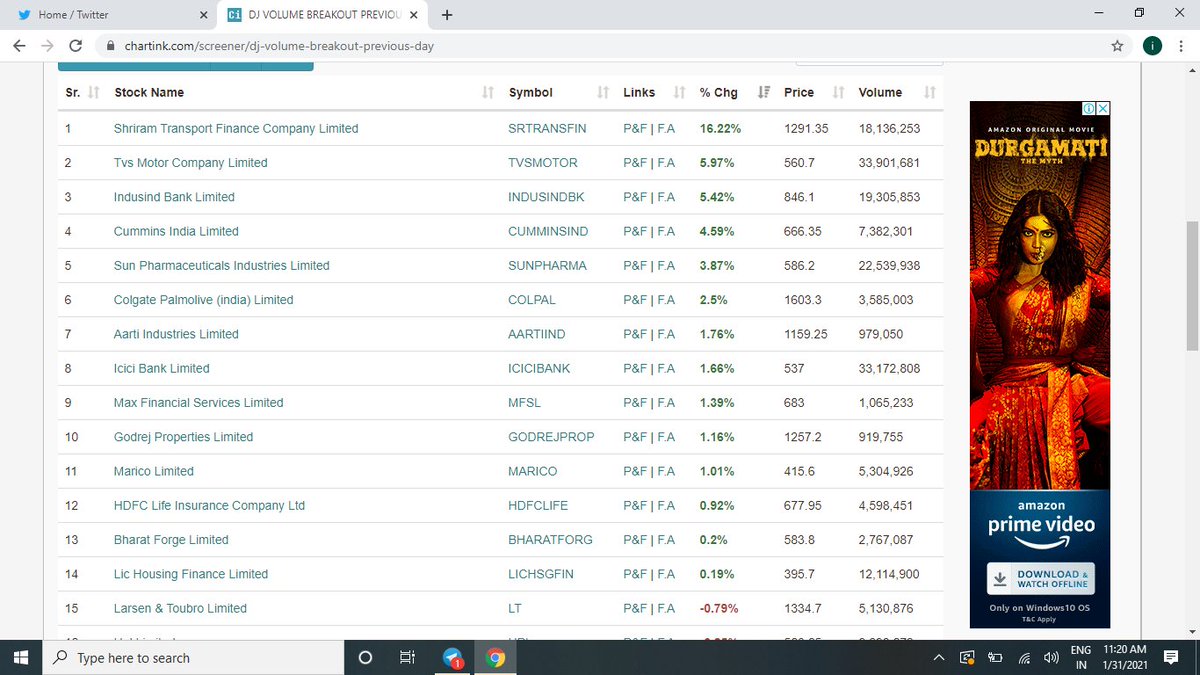
Hope Everyone saw BANDHANBNK Numbers. I feel many such banks will go through a massive NPA Cycle followed by depleted Tier 1.
— Saket Reddy (@saketreddy) January 24, 2021
Hence, stay with the Top 3 banks :-
HDFCBANK
KOTAKBANK
CUB
They've low cost of funding, well provisioned Moratorium book, high ROEs & high Tier 1 CAR.
#OpenDrive#intradaySetup
— Pathik (@Pathik_Trader) April 16, 2019
Sharing one high probability trending setup for intraday.
Few conditions needs to be met
1. Opening should be above/below previous day high/low for buy/sell setup.
2. Open=low (for buy)
Open=high (for sell)
(1/n)
Already explained strategy of #opendrive
— Pathik (@Pathik_Trader) May 27, 2020
Backtested results in 30 stocks and nifty, banknifty.
Success ratio : approx 40-45%
RR average 1:2
Entry as per strategy
Stoploss = Open level
Exit 3:15 PM Or SL
39 months 14 months -ve, 25 +ve
Yearly all 4 years +ve performance. pic.twitter.com/nGqhzMKGVy
So today we will discuss two more price action setups to get good long side trade for intraday.
— Pathik (@Pathik_Trader) June 20, 2020
1. PDC Acts as Support
2. PDH Acts as Support
#nifty
— Pathik (@Pathik_Trader) June 23, 2020
This is how it created long setup by taking support at PDC.
hopefully shared setup on last weekend helped. pic.twitter.com/2mduSUpMn5
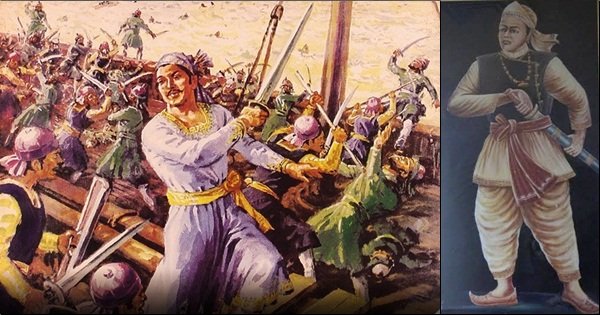
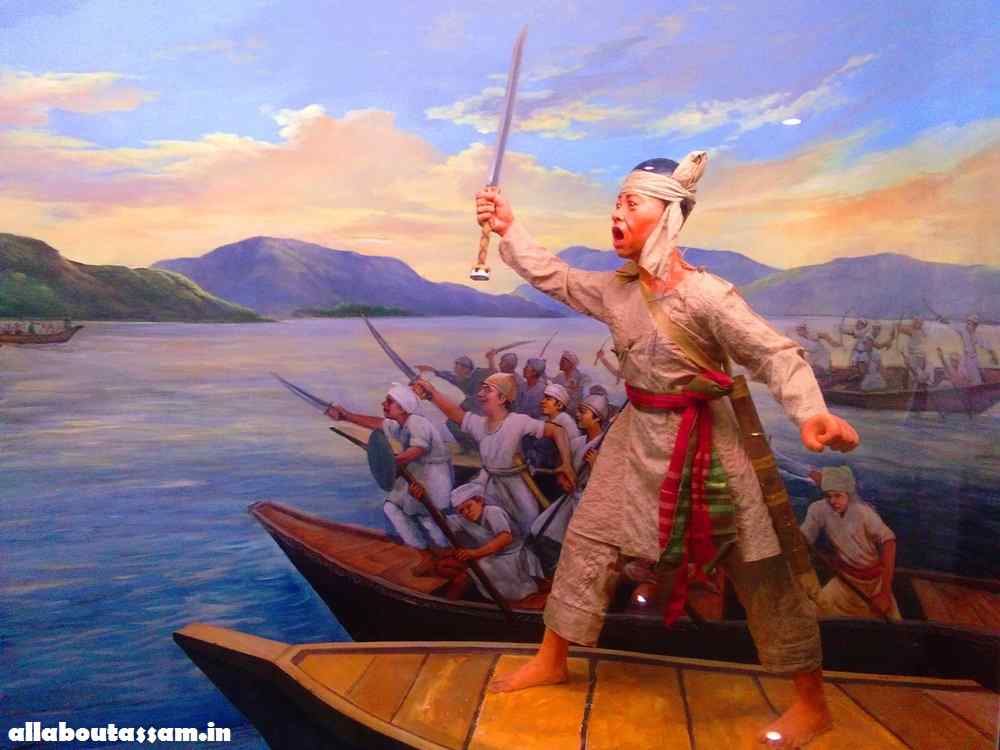
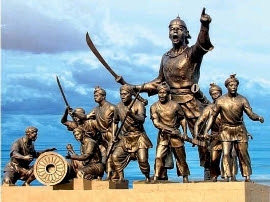
#CandleTrading : #Bullish #Belthold#Pattern #Psychology :Pattern importance could be traced back to the traditional #Japanese sport of \u2018Sumo #wrestling'. The importance of \u2018Mawashi ( Wrestlers Belt) \u2019 & its tactical move for gripping the opponent to throwing him off the ring. pic.twitter.com/lN60xad6Ma
— Sacchitanand Uttekar (@Sacchitananad) August 16, 2020