Macd measures the difference between two Exponential Moving Averages (EMAs).
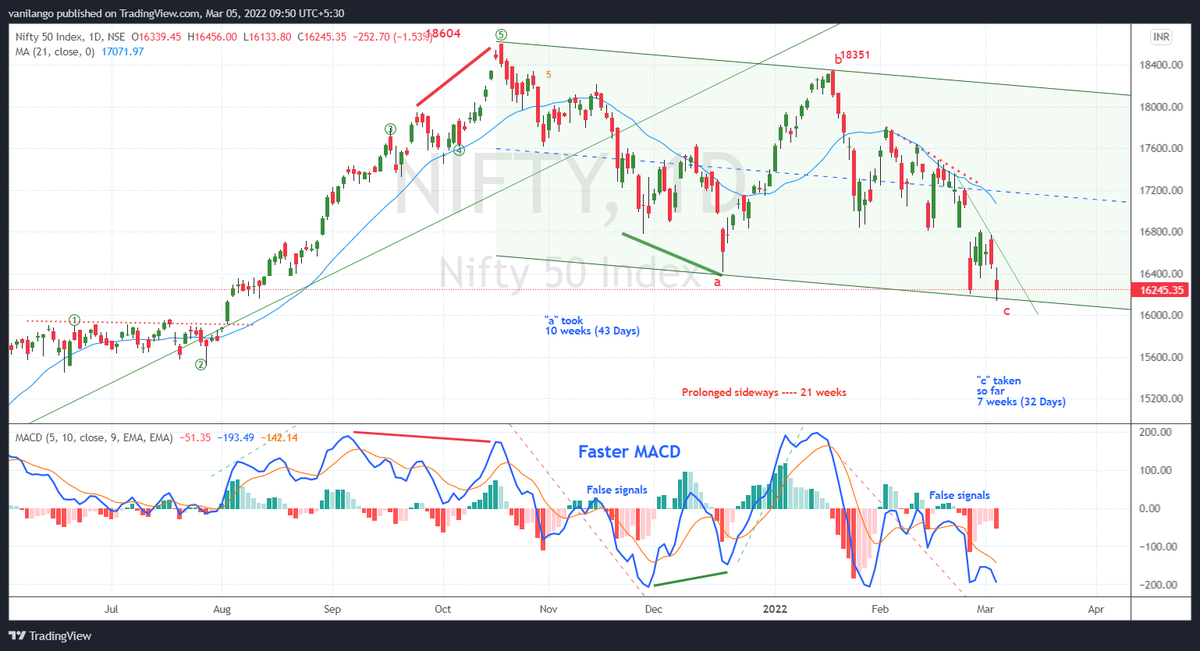


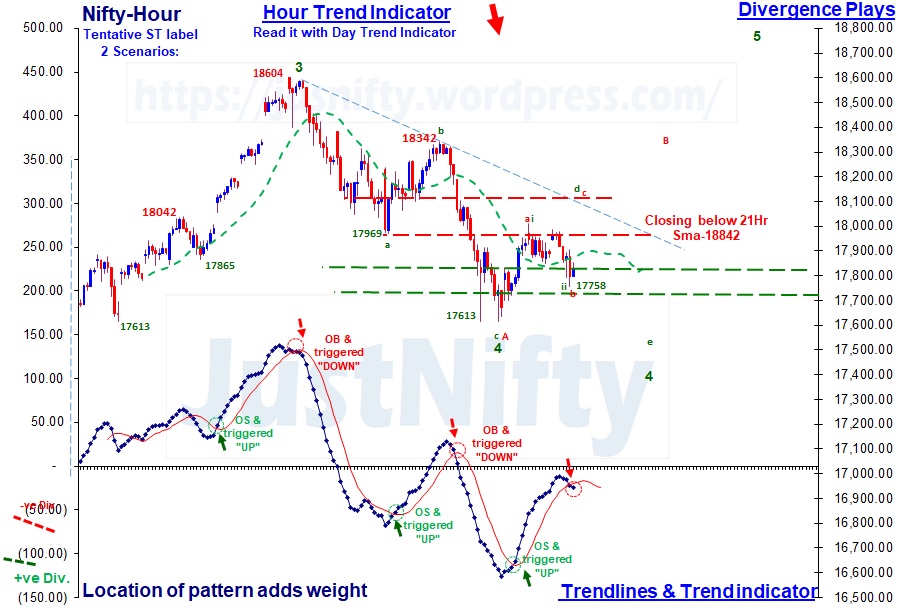
Currently reading the book you put on your website. Also, from this if we consider 18600 as 5 th wave end of Nifty ideally it's doing the 1st 12345 of downtrend, of which do e already 1234, currently going towards 5 which I believe should go below 100% of 4th retracement wave
— de soloist \U0001f1ee\U0001f1f3 (@ChakiArijit) November 4, 2021
#auropharma "Hour t/f" for "Traders"
— Van Ilango (JustNifty) (@JustNifty) March 21, 2022
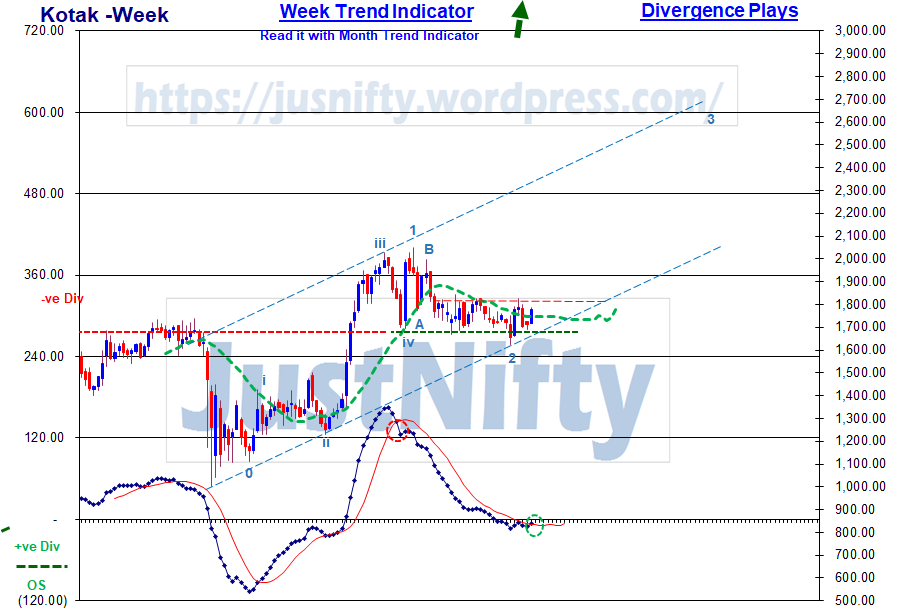
In search of the highly rewarding 2nd wave entry.
Today's & tomorrow's #priceaction would have more clarity for entry either @ 615-620 or above 655 https://t.co/20S0Lvc7ej pic.twitter.com/OFlf9MLkqz
#Elliottwave puts #PriceAction in it's context
— Van Ilango (JustNifty) (@JustNifty) December 2, 2021
You're 1 undisputed expert on prime source of everything, #PriceAction
Let beginner start with #PriceAction & then step up to 12345 & ABC
Baby steps alone will take to maturity
Read this book months ago - "Rich Experience shared"\U0001f64f https://t.co/VUbG6F5Ems pic.twitter.com/PProaFsMsV