What is Relative Strength and how can it be used for trading?
Learn all about this Momentum Indicator: https://t.co/5KcE7kY6cp
#technicalanalysis #trading #rsi
More from StockEdge


StockEdge Presents: Strong RS Stocks With Squeeze Eruption: A Special Combination Scan!
🧵...
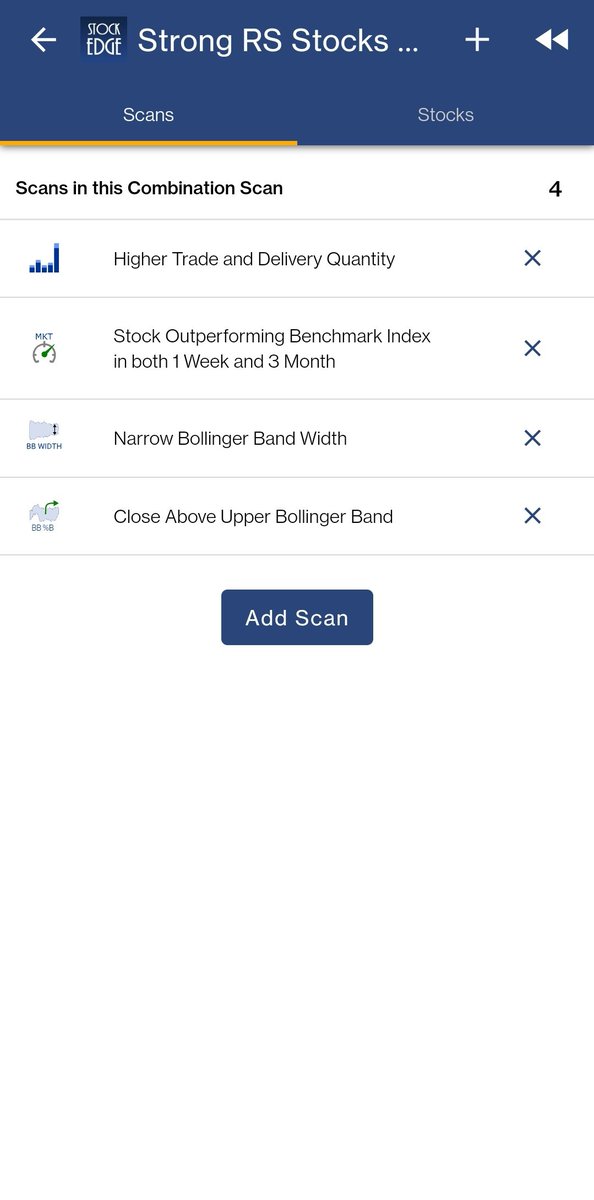
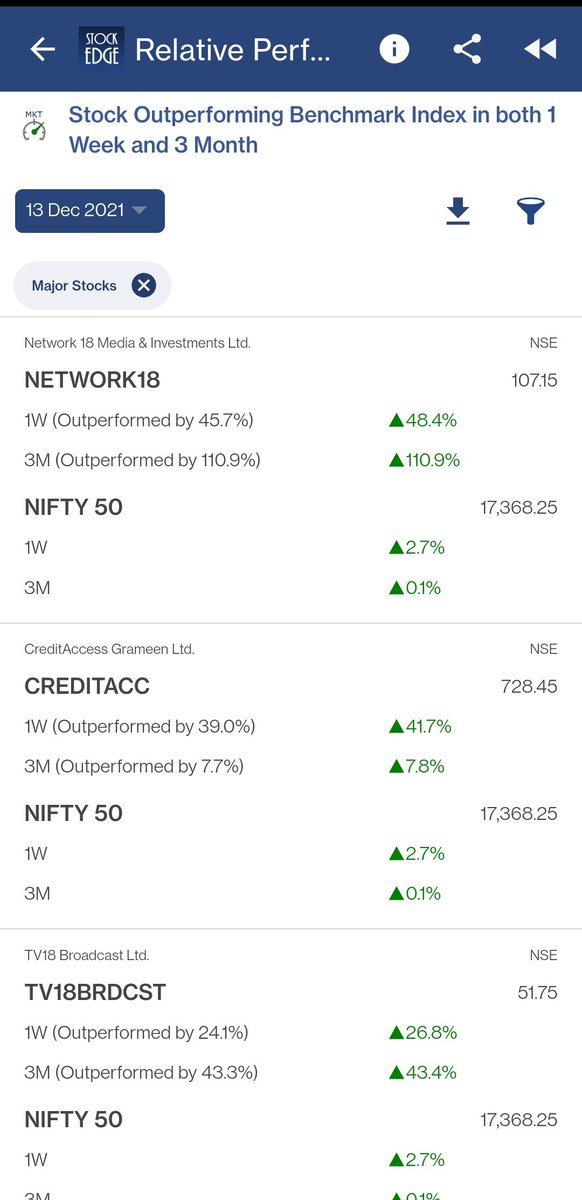
This combination scan identifies stocks that are outperforming Benchmark Indices in 1 week as well as 3 months time frame.
It also identities stocks that have consolidated in a narrow range for some time and breaks the zone with a higher trade & delivery quantity.
Some of the scans used in the combination include
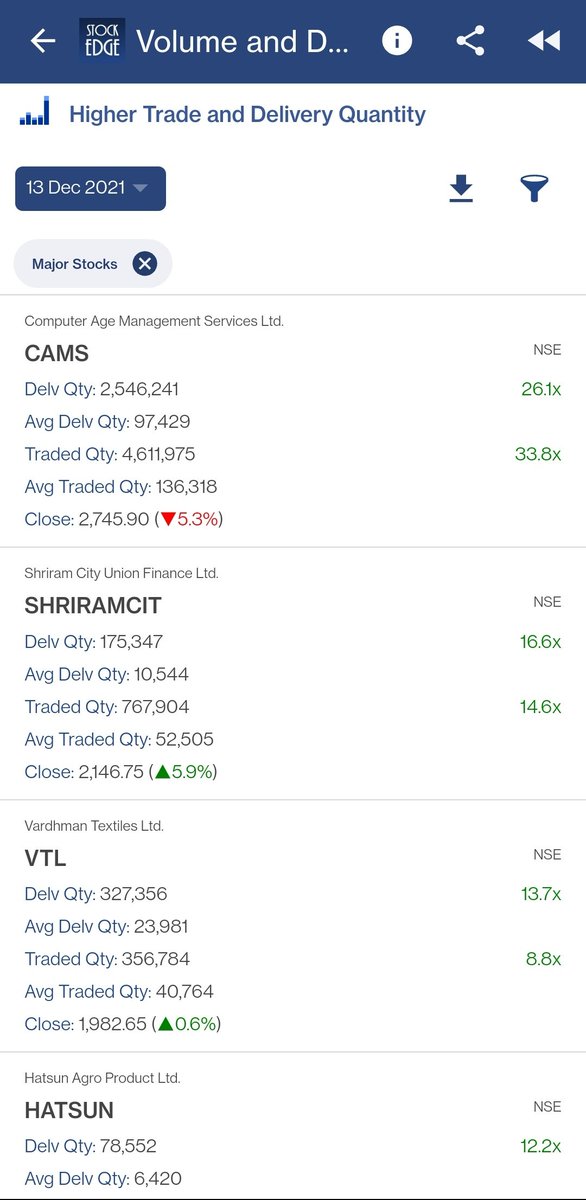
-Higher Trade and Delivery Quantity https://t.co/9CiSwEADrF
The second scan used here is Stocks Outperforming Benchmark Index in both 1 week and 3 month: https://t.co/dv9e3KK810
🧵...
This combination scan identifies stocks that are outperforming Benchmark Indices in 1 week as well as 3 months time frame.
It also identities stocks that have consolidated in a narrow range for some time and breaks the zone with a higher trade & delivery quantity.
Some of the scans used in the combination include
-Higher Trade and Delivery Quantity https://t.co/9CiSwEADrF
The second scan used here is Stocks Outperforming Benchmark Index in both 1 week and 3 month: https://t.co/dv9e3KK810
One of our users submitted a special Scan:
A THREAD(🧵)....(1/7)
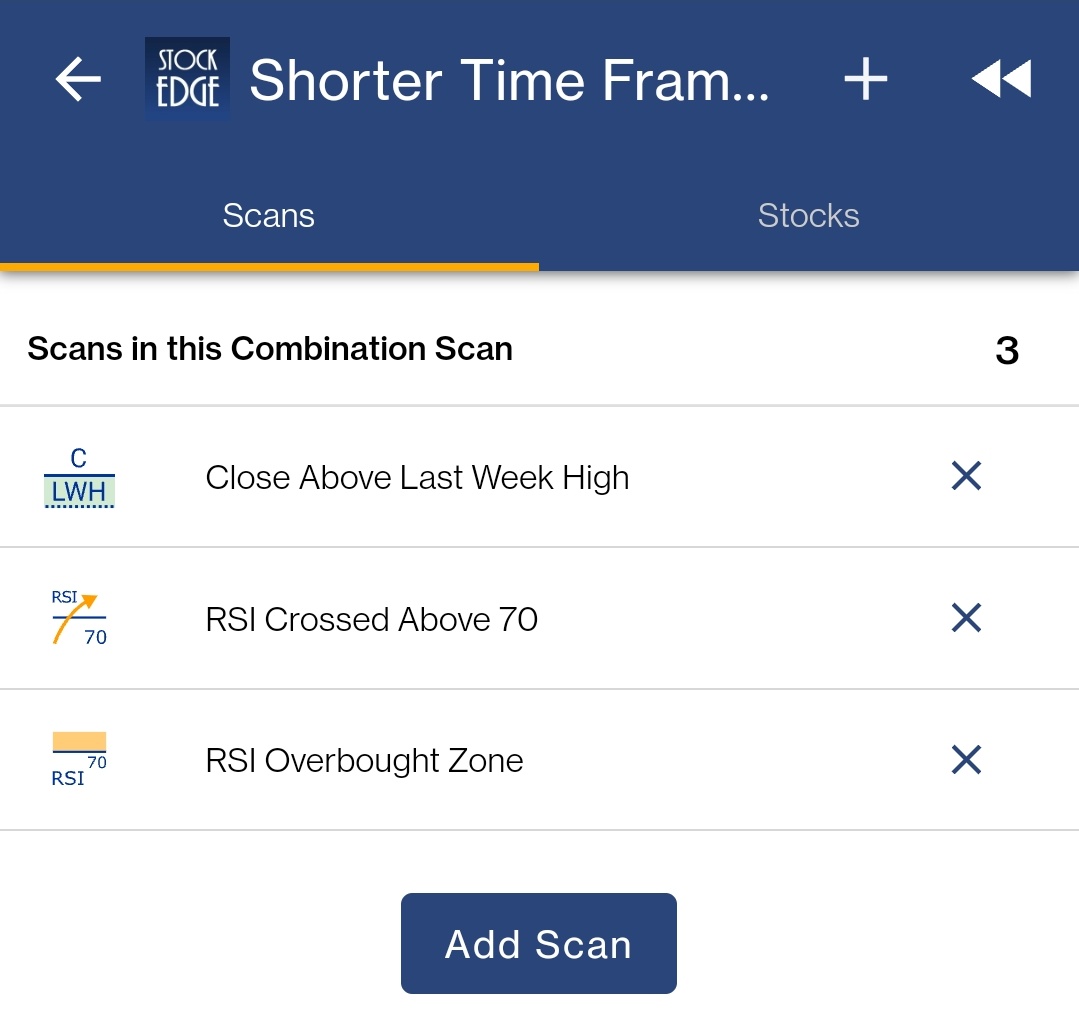
This Combo scan tries to filter stocks based on strong momentum for short term trades
(2/7)
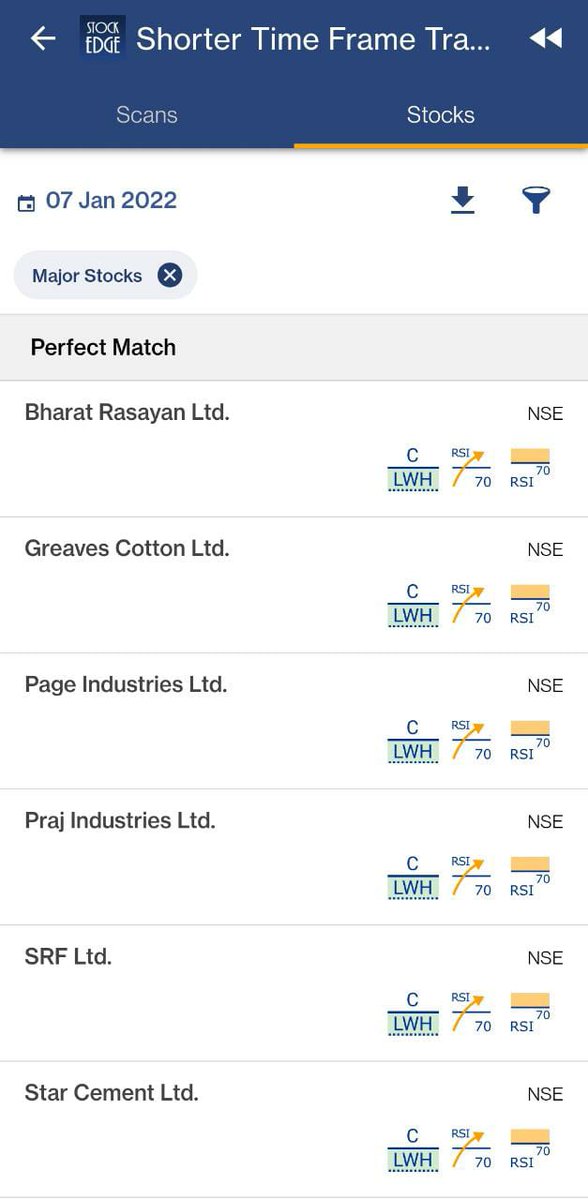
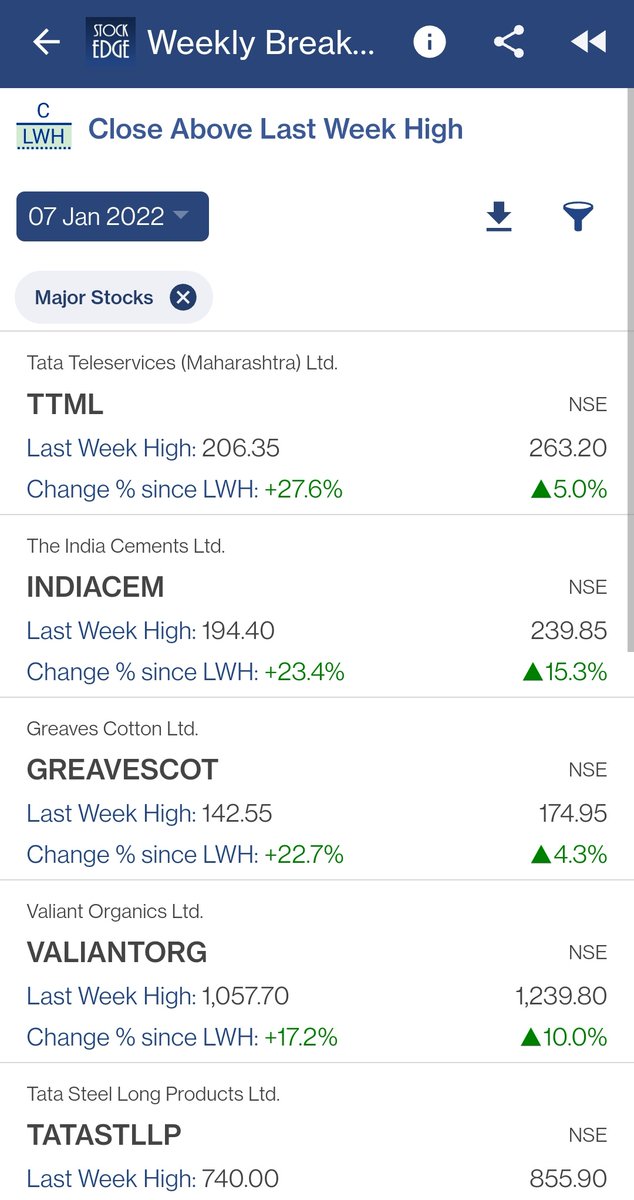
The first scan used here is Close Above Last Week High
https://t.co/ehv5ke8sxc
(3/7)
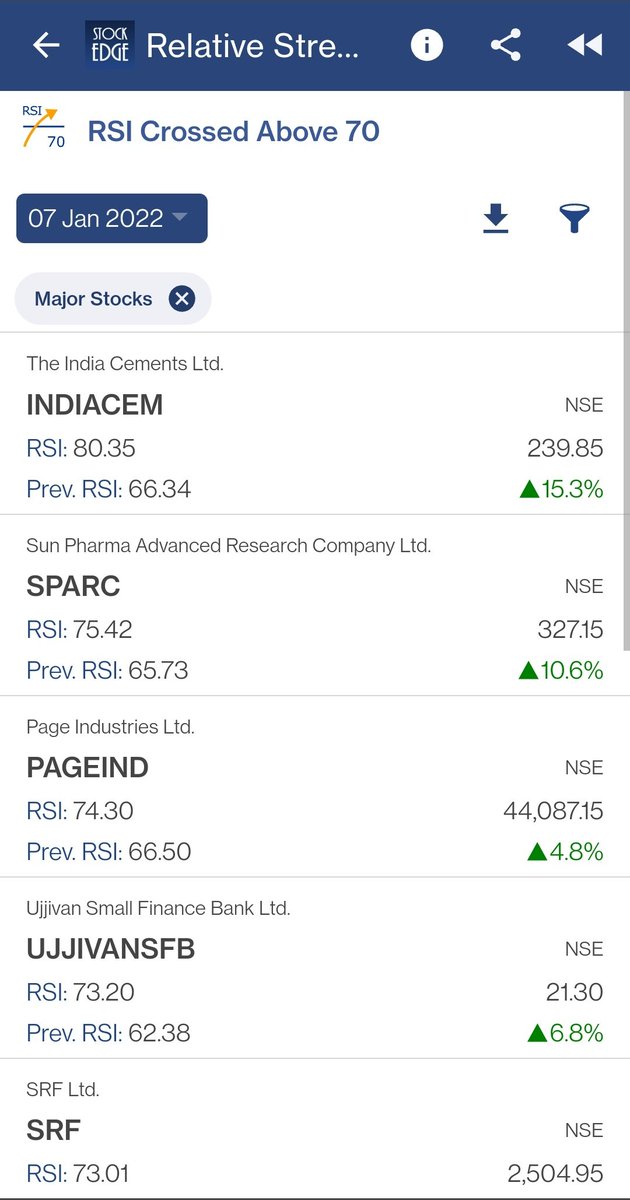
The Second Scan in the combo is RSI Crossed above 70 https://t.co/q4NpyFYuBD
(4/7)
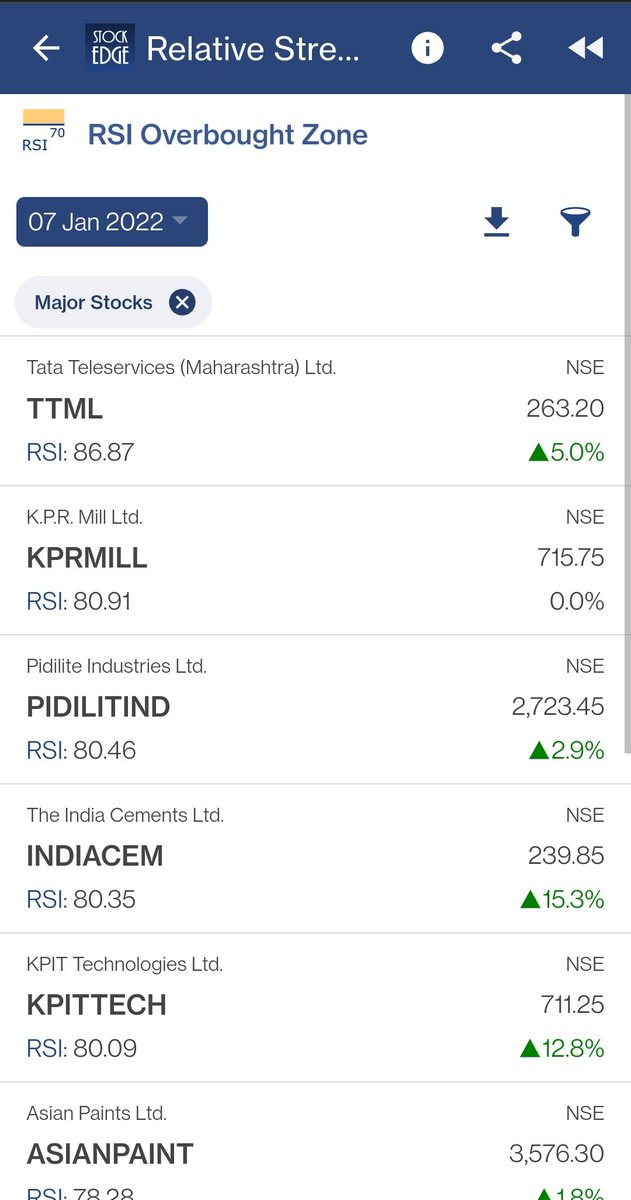
The Third Scan used here is RSI Overbought Zone https://t.co/5uZxwnLAUD
(5/7)
A THREAD(🧵)....(1/7)
This Combo scan tries to filter stocks based on strong momentum for short term trades
(2/7)
The first scan used here is Close Above Last Week High
https://t.co/ehv5ke8sxc
(3/7)
The Second Scan in the combo is RSI Crossed above 70 https://t.co/q4NpyFYuBD
(4/7)
The Third Scan used here is RSI Overbought Zone https://t.co/5uZxwnLAUD
(5/7)
More from Rs


#RS is an indicator which helps in finding strong stock or index in the market.
This learning thread would be on
"𝙐𝙨𝙚𝙨 𝙤𝙛 𝙍𝙚𝙡𝙖𝙩𝙞𝙫𝙚 𝙎𝙩𝙧𝙚𝙣𝙜𝙩𝙝"
Shared some strategy.
Like👍 & Retweet🔄for wider reach and for more such learning thread in the future.
1/22
Most of us would confuse it with Relative Strength Index (RSI) but Relative Strength is a different indicator.
We have already covered about "Uses of RSI" in below thread👇
https://t.co/oTOrW7joNI
One can go through this if you haven't.
2/22
Now coming to Relative Strength (RS).
It is basically a strategy used in momentum investing which shows strength or weakness between two asset classes (two stocks, index, commodity).
One can read about this in below
As of now, I am using this indicator on .@tradingview platform.
It's free and one can add it in their Tradingview account as well, using this link👇
https://t.co/FxCjJFsNOG
There are multiple variants in this as well. Some traders use multiple time frame RS.
4/22
RS basically compares returns of one stock/index with the returns of benchmark stock/index at a particular time horizon.
Let's say, I want to analyze TCS and Benchmark Index is Nifty.
5/22
This learning thread would be on
"𝙐𝙨𝙚𝙨 𝙤𝙛 𝙍𝙚𝙡𝙖𝙩𝙞𝙫𝙚 𝙎𝙩𝙧𝙚𝙣𝙜𝙩𝙝"
Shared some strategy.
Like👍 & Retweet🔄for wider reach and for more such learning thread in the future.
1/22
Most of us would confuse it with Relative Strength Index (RSI) but Relative Strength is a different indicator.
We have already covered about "Uses of RSI" in below thread👇
https://t.co/oTOrW7joNI
One can go through this if you haven't.
2/22
#RSI is a common indicator which most of us use in the stock market.
— Yash Mehta (@YMehta_) October 22, 2021
This learning thread would be on
"\U0001d650\U0001d668\U0001d65a\U0001d668 \U0001d664\U0001d65b \U0001d64d\U0001d64e\U0001d644"
Like\U0001f44d & Retweet\U0001f504 for wider reach and for more such learning thread in the future.
Also, an investment strategy is shared using RSI in the end.
1/16
Now coming to Relative Strength (RS).
It is basically a strategy used in momentum investing which shows strength or weakness between two asset classes (two stocks, index, commodity).
One can read about this in below
As of now, I am using this indicator on .@tradingview platform.
It's free and one can add it in their Tradingview account as well, using this link👇
https://t.co/FxCjJFsNOG
There are multiple variants in this as well. Some traders use multiple time frame RS.
4/22
RS basically compares returns of one stock/index with the returns of benchmark stock/index at a particular time horizon.
Let's say, I want to analyze TCS and Benchmark Index is Nifty.
5/22