
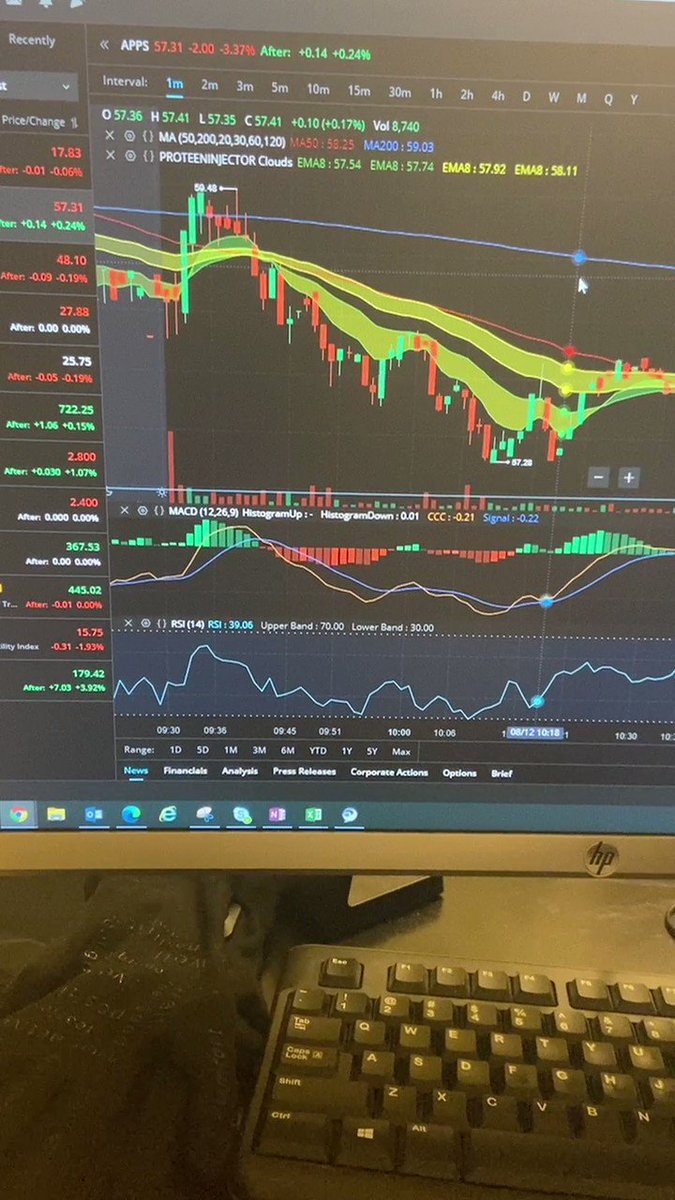
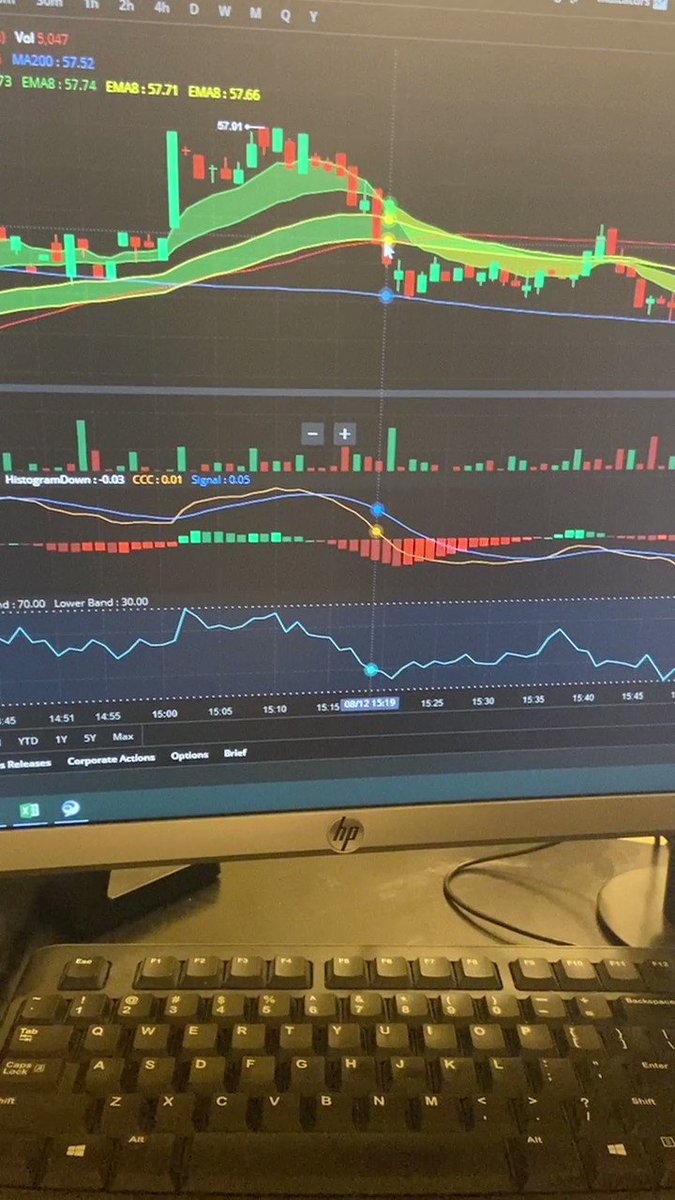
Who wants a video on how I day traded $apps using @ripster47 clouds? @TalatiTapan 😉
I was not super profitable, but this was the first time I tried out the clouds during a day trade. Something clicked and I wanted to share. Please correct me if I’m wrong, only way I’ll learn!
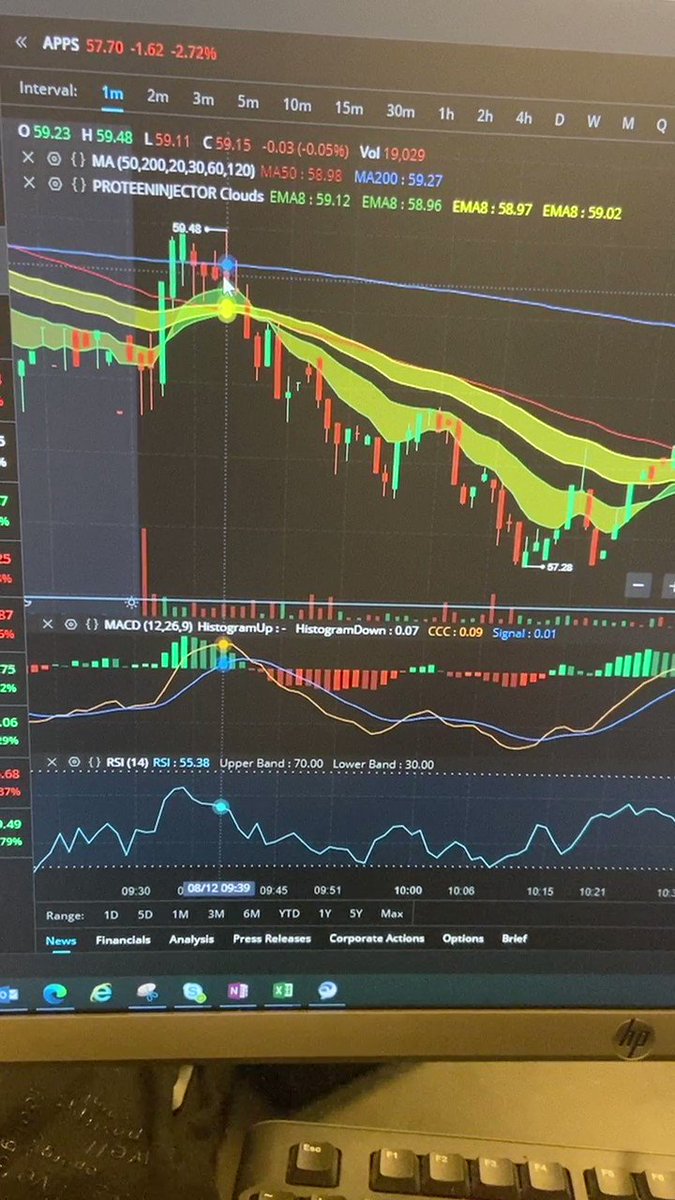
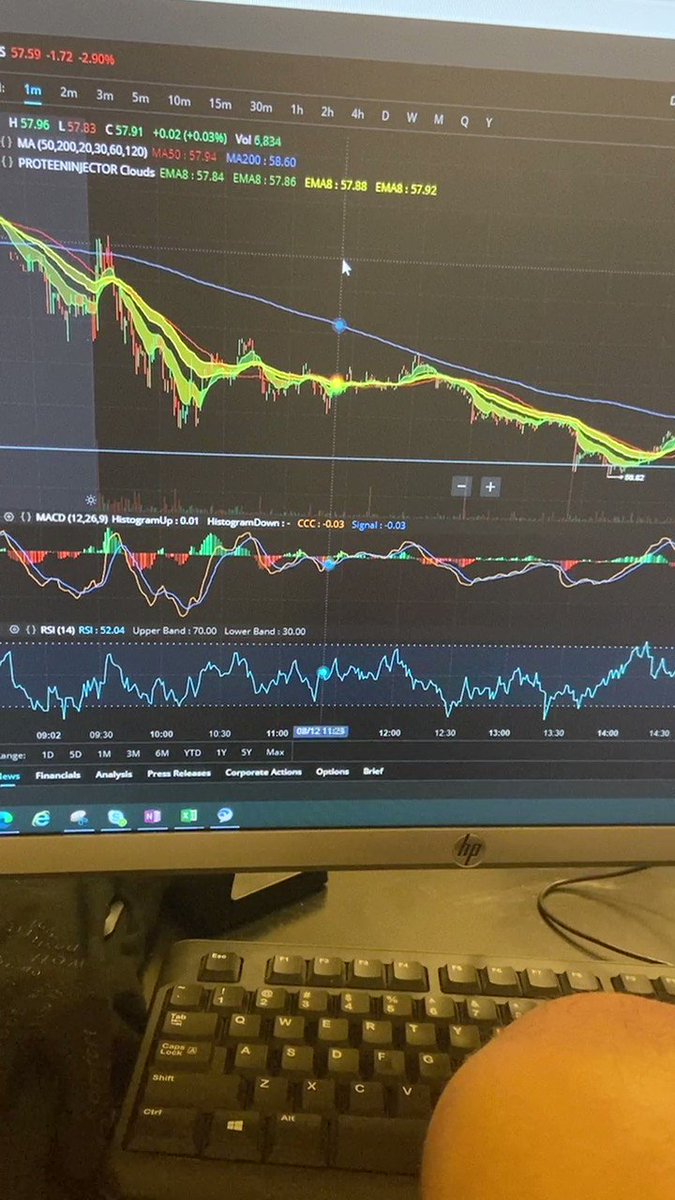
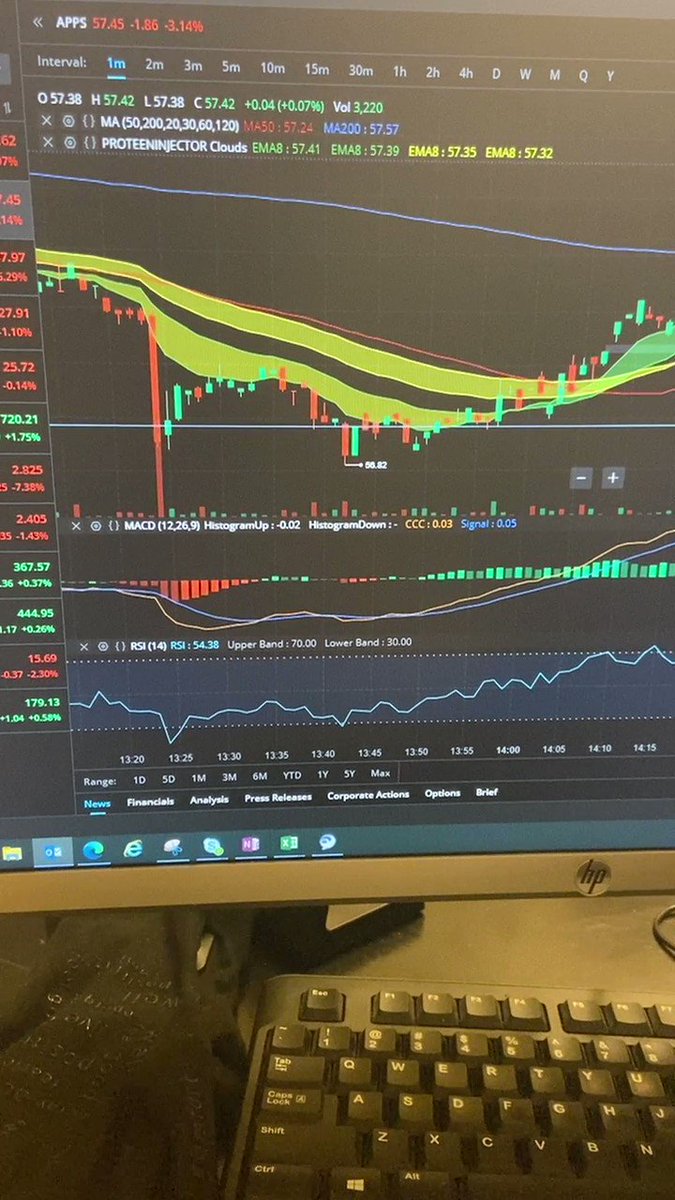

It’s not about the amount of money I made, it’s the knowledge I learned in one trade. The clouds help new and seasoned traders visually see trends and manage risk accordingly. #LuvUall10!
You May Also Like

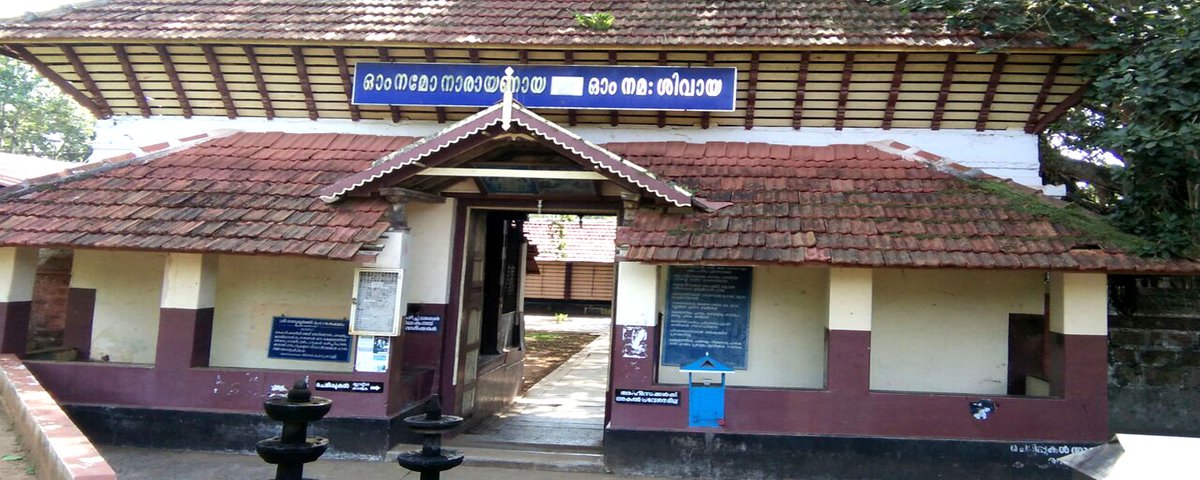


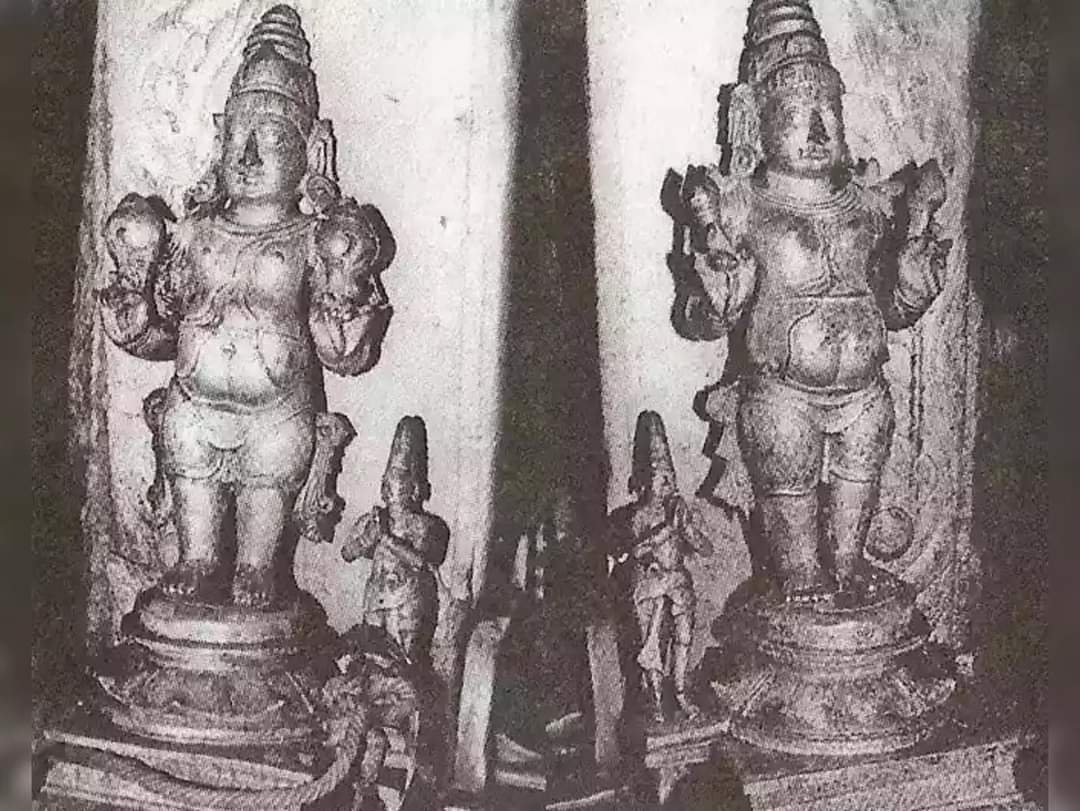

#ஆதித்தியஹ்ருதயம் ஸ்தோத்திரம்
இது சூரிய குலத்தில் உதித்த இராமபிரானுக்கு தமிழ் முனிவர் அகத்தியர் உபதேசித்ததாக வால்மீகி இராமாயணத்தில் வருகிறது. ஆதித்ய ஹ்ருதயத்தைத் தினமும் ஓதினால் பெரும் பயன் பெறலாம் என மகான்களும் ஞானிகளும் காலம் காலமாகக் கூறி வருகின்றனர். ராம-ராவண யுத்தத்தை
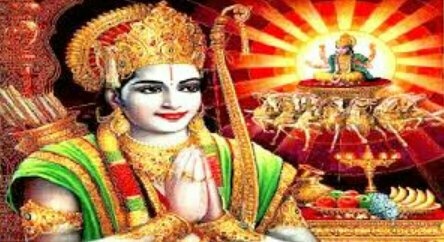
தேவர்களுடன் சேர்ந்து பார்க்க வந்திருந்த அகத்தியர், அப்போது போரினால் களைத்து, கவலையுடன் காணப்பட்ட ராமபிரானை அணுகி, மனிதர்களிலேயே சிறந்தவனான ராமா போரில் எந்த மந்திரத்தைப் பாராயணம் செய்தால் எல்லா பகைவர்களையும் வெல்ல முடியுமோ அந்த ரகசிய மந்திரத்தை, வேதத்தில் சொல்லப்பட்டுள்ளதை உனக்கு
நான் உபதேசிக்கிறேன், கேள் என்று கூறி உபதேசித்தார். முதல் இரு சுலோகங்கள் சூழ்நிலையை விவரிக்கின்றன. மூன்றாவது சுலோகம் அகத்தியர் இராமபிரானை விளித்துக் கூறுவதாக அமைந்திருக்கிறது. நான்காவது சுலோகம் முதல் முப்பதாம் சுலோகம் வரை ஆதித்ய ஹ்ருதயம் என்னும் நூல். முப்பத்தி ஒன்றாம் சுலோகம்
இந்தத் துதியால் மகிழ்ந்த சூரியன் இராமனை வாழ்த்துவதைக் கூறுவதாக அமைந்திருக்கிறது.
ஐந்தாவது ஸ்லோகம்:
ஸர்வ மங்கள் மாங்கல்யம் ஸர்வ பாப ப்ரநாசனம்
சிந்தா சோக ப்ரசமனம் ஆயுர் வர்த்தனம் உத்தமம்
பொருள்: இந்த அதித்ய ஹ்ருதயம் என்ற துதி மங்களங்களில் சிறந்தது, பாவங்களையும் கவலைகளையும்
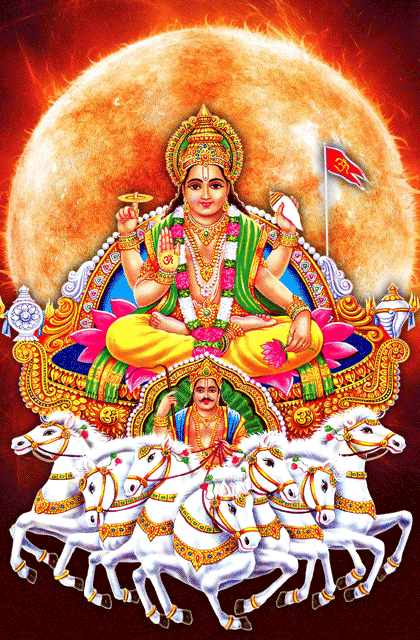
குழப்பங்களையும் நீக்குவது, வாழ்நாளை நீட்டிப்பது, மிகவும் சிறந்தது. இதயத்தில் வசிக்கும் பகவானுடைய அனுக்ரகத்தை அளிப்பதாகும்.
முழு ஸ்லோக லிங்க் பொருளுடன் இங்கே உள்ளது https://t.co/Q3qm1TfPmk
சூரியன் உலக இயக்கத்திற்கு மிக முக்கியமானவர். சூரிய சக்தியால்தான் ஜீவராசிகள், பயிர்கள்
இது சூரிய குலத்தில் உதித்த இராமபிரானுக்கு தமிழ் முனிவர் அகத்தியர் உபதேசித்ததாக வால்மீகி இராமாயணத்தில் வருகிறது. ஆதித்ய ஹ்ருதயத்தைத் தினமும் ஓதினால் பெரும் பயன் பெறலாம் என மகான்களும் ஞானிகளும் காலம் காலமாகக் கூறி வருகின்றனர். ராம-ராவண யுத்தத்தை
தேவர்களுடன் சேர்ந்து பார்க்க வந்திருந்த அகத்தியர், அப்போது போரினால் களைத்து, கவலையுடன் காணப்பட்ட ராமபிரானை அணுகி, மனிதர்களிலேயே சிறந்தவனான ராமா போரில் எந்த மந்திரத்தைப் பாராயணம் செய்தால் எல்லா பகைவர்களையும் வெல்ல முடியுமோ அந்த ரகசிய மந்திரத்தை, வேதத்தில் சொல்லப்பட்டுள்ளதை உனக்கு
நான் உபதேசிக்கிறேன், கேள் என்று கூறி உபதேசித்தார். முதல் இரு சுலோகங்கள் சூழ்நிலையை விவரிக்கின்றன. மூன்றாவது சுலோகம் அகத்தியர் இராமபிரானை விளித்துக் கூறுவதாக அமைந்திருக்கிறது. நான்காவது சுலோகம் முதல் முப்பதாம் சுலோகம் வரை ஆதித்ய ஹ்ருதயம் என்னும் நூல். முப்பத்தி ஒன்றாம் சுலோகம்
இந்தத் துதியால் மகிழ்ந்த சூரியன் இராமனை வாழ்த்துவதைக் கூறுவதாக அமைந்திருக்கிறது.
ஐந்தாவது ஸ்லோகம்:
ஸர்வ மங்கள் மாங்கல்யம் ஸர்வ பாப ப்ரநாசனம்
சிந்தா சோக ப்ரசமனம் ஆயுர் வர்த்தனம் உத்தமம்
பொருள்: இந்த அதித்ய ஹ்ருதயம் என்ற துதி மங்களங்களில் சிறந்தது, பாவங்களையும் கவலைகளையும்
குழப்பங்களையும் நீக்குவது, வாழ்நாளை நீட்டிப்பது, மிகவும் சிறந்தது. இதயத்தில் வசிக்கும் பகவானுடைய அனுக்ரகத்தை அளிப்பதாகும்.
முழு ஸ்லோக லிங்க் பொருளுடன் இங்கே உள்ளது https://t.co/Q3qm1TfPmk
சூரியன் உலக இயக்கத்திற்கு மிக முக்கியமானவர். சூரிய சக்தியால்தான் ஜீவராசிகள், பயிர்கள்