The real estate market in India expanded at a CAGR of ~10% from $50bn to $120bn between 2008-17.
It's estimated to expand at a CAGR of 17.7% to $1tn by 2030. It will added $820bn in 10 years from $180bn in 2020.
Will throw a number of opportunities along the way.
More from Sahil Kapoor
More from Real estate
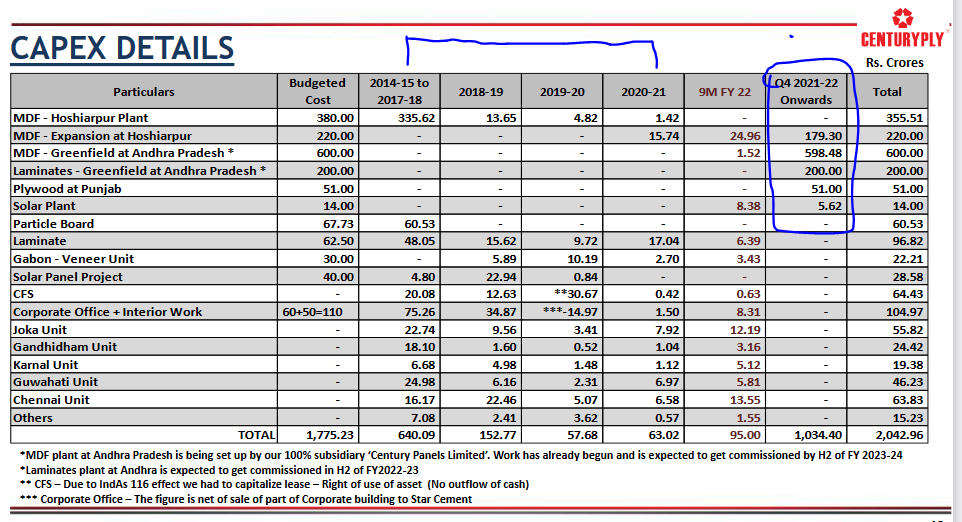
Domestic MDF market size is pegged at 2500Cr currently & is
expected to grow at 15% CAGR over the next 3 years (organised players to grow even faster).
The industry further has potential to capture incremental opportunity of 4500-5000Cr low-end plywood market. https://t.co/Cre3xVUNqu
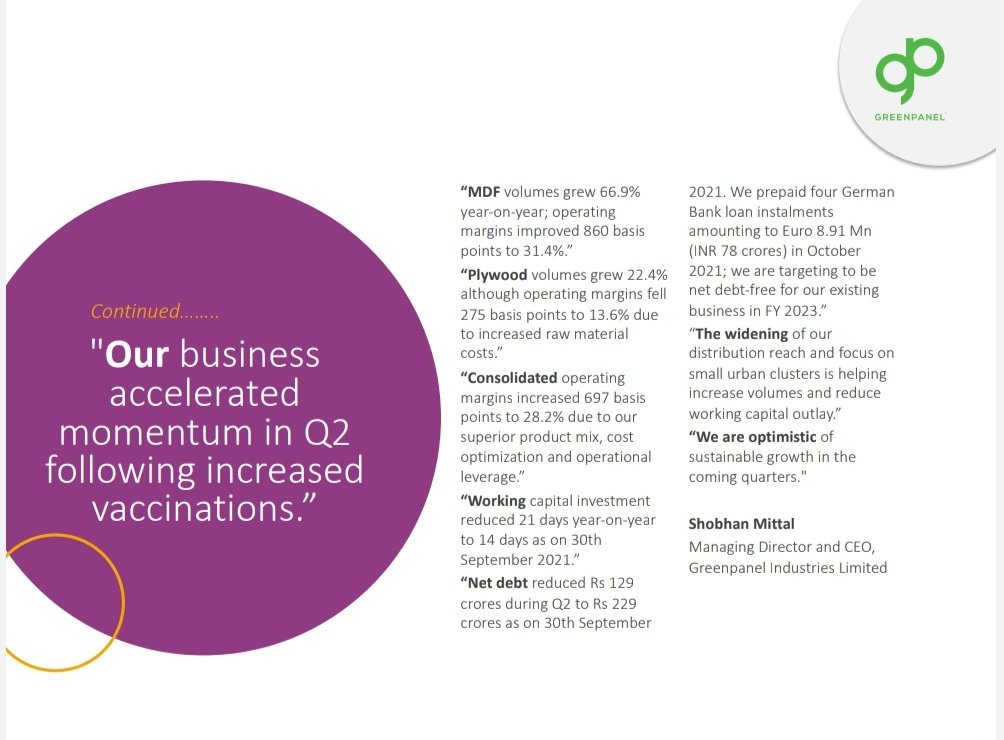
GREENPANEL had 1,400 dealers (retail business) as of FY21 and added 250 dealers in 6MFY22. Target to
increase this to 2,200 by FY23.
The industry further has potential to capture incremental opportunity of 4500-5000Cr low-end plywood market. https://t.co/Cre3xVUNqu

GREENPANEL would grow earnings at 15-20% CAGR over the next 3-5 years with ROCE & Margin expansion once they commision the de-bottlenecked capacity in FY22 and the brownfield AP CAPEX in FY23/FY24.
— Saket Reddy (@saketreddy) October 14, 2021
Huge runway for growth, industry structure (both MDF & RE) turned for the good! https://t.co/jFTZCwhNMS
GREENPANEL had 1,400 dealers (retail business) as of FY21 and added 250 dealers in 6MFY22. Target to
increase this to 2,200 by FY23.
You May Also Like
The first area to focus on is diversity. This has become a dogma in the tech world, and despite the fact that tech is one of the most meritocratic industries in the world, there are constant efforts to promote diversity at the expense of fairness, merit and competency. Examples:
USC's Interactive Media & Games Division cancels all-star panel that included top-tier game developers who were invited to share their experiences with students. Why? Because there were no women on the
ElectronConf is a conf which chooses presenters based on blind auditions; the identity, gender, and race of the speaker is not known to the selection team. The results of that merit-based approach was an all-male panel. So they cancelled the conference.
Apple's head of diversity (a black woman) got in trouble for promoting a vision of diversity that is at odds with contemporary progressive dogma. (She left the company shortly after this
Also in the name of diversity, there is unabashed discrimination against men (especially white men) in tech, in both hiring policies and in other arenas. One such example is this, a developer workshop that specifically excluded men: https://t.co/N0SkH4hR35


