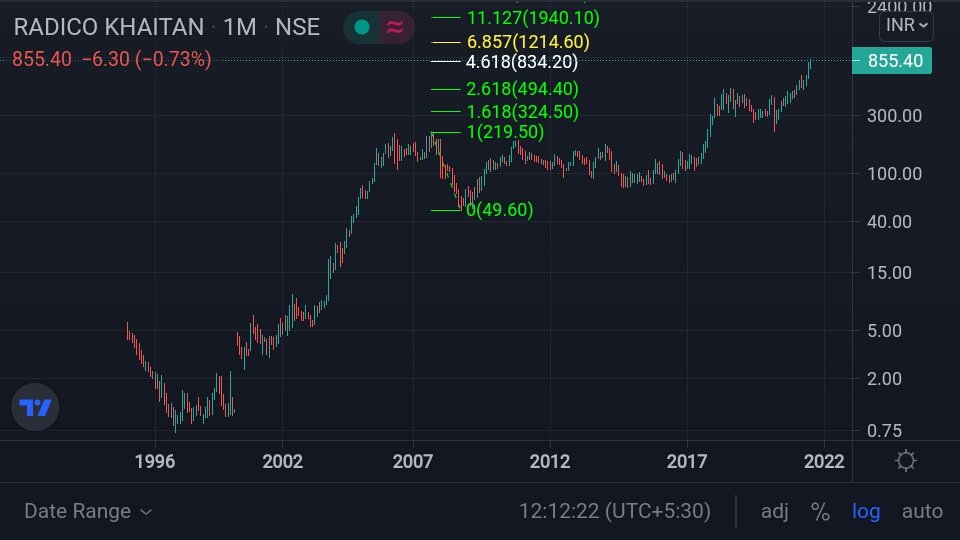
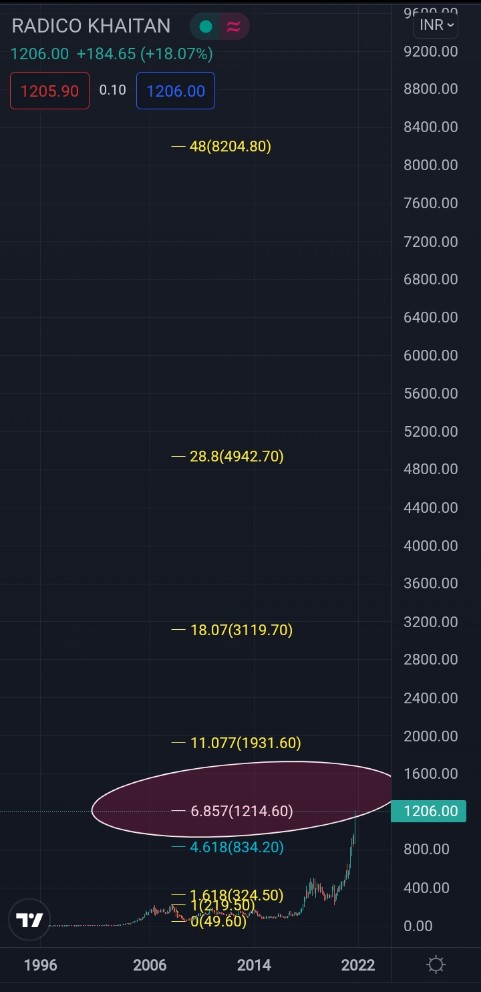
#RADICO-1214.80
#Fibonacci extension..
6.857%(1214.60) Done.
further Fibonacci extension on sustain rise above 1215
11.077(1931)
#Probability
More from Waves_Perception(Dinesh Patel) मैंSchedule Tribes)

More from Radico

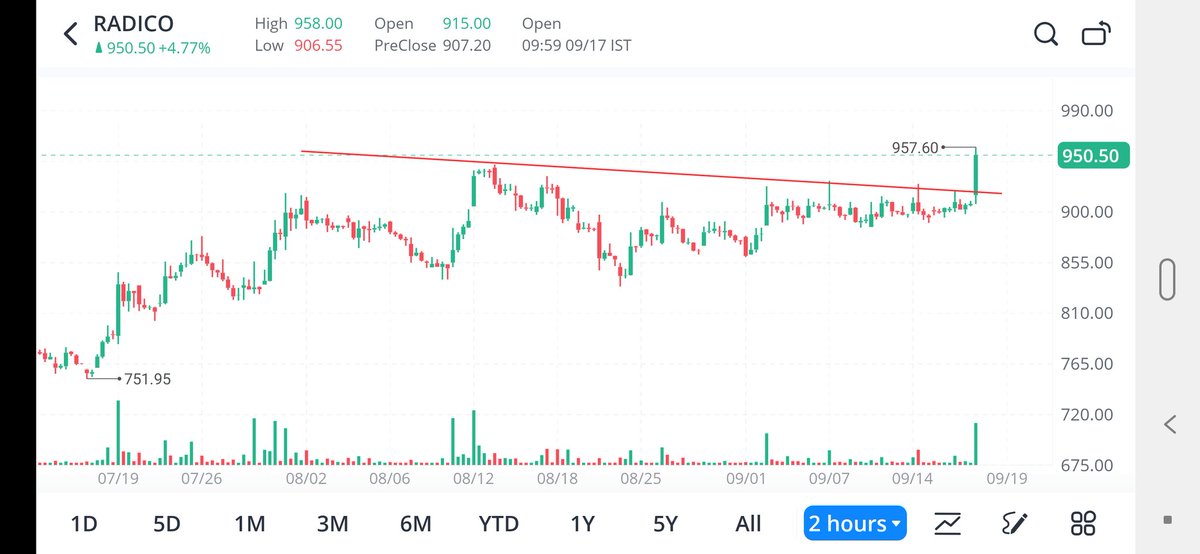
#Radico reached our 1st target and is trading at 870 now.
@MD_ABNSTOCKS
@MD_ABNSTOCKS
#Radico #StockToWatch #Stock #Equity #StockMarket
— Team MD&ABN (@team_md_abn) July 10, 2021
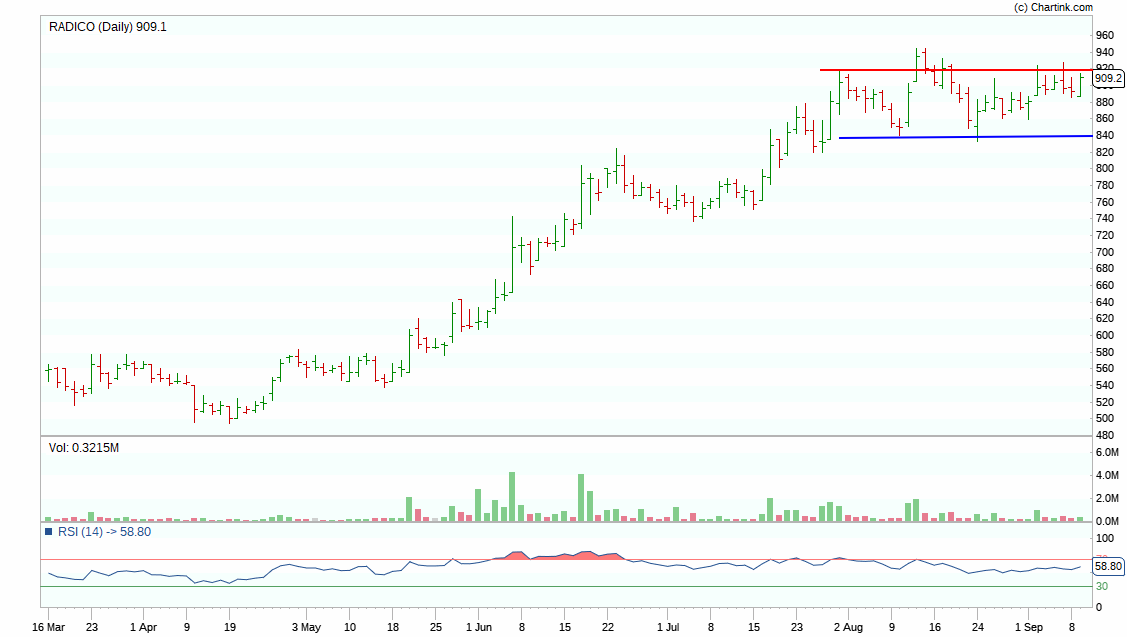
CMP - 779
Entry - once price closes above 783 in the hourly chart
Pattern invalid below - 736.50
Possible upside Levels
Conservative - 866
Aggressive - 944@caniravkaria pic.twitter.com/6xD7oywkNC