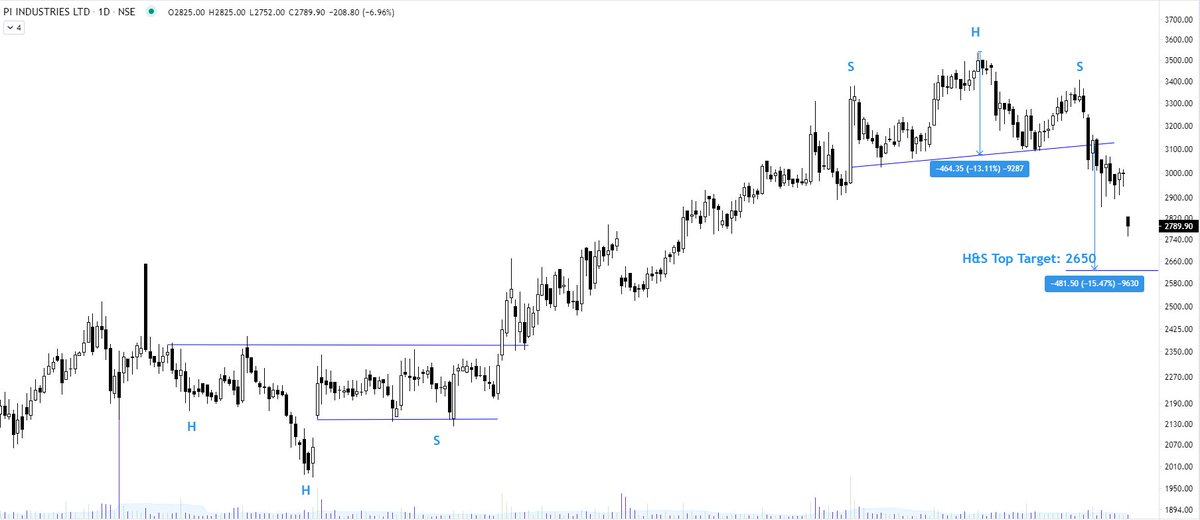
PI Industries - A textbook H&S. Why? Because in an H&S pattern, the volume peaks at left shoulder. The volume diminishes at the head which is the first warning signal. Thereafter, the stock is unable to form a fresh high at RS at even lower volumes leading to a breakdown.
More from The_Chartist 📈
✅✅ https://t.co/MtJOLfpzYj
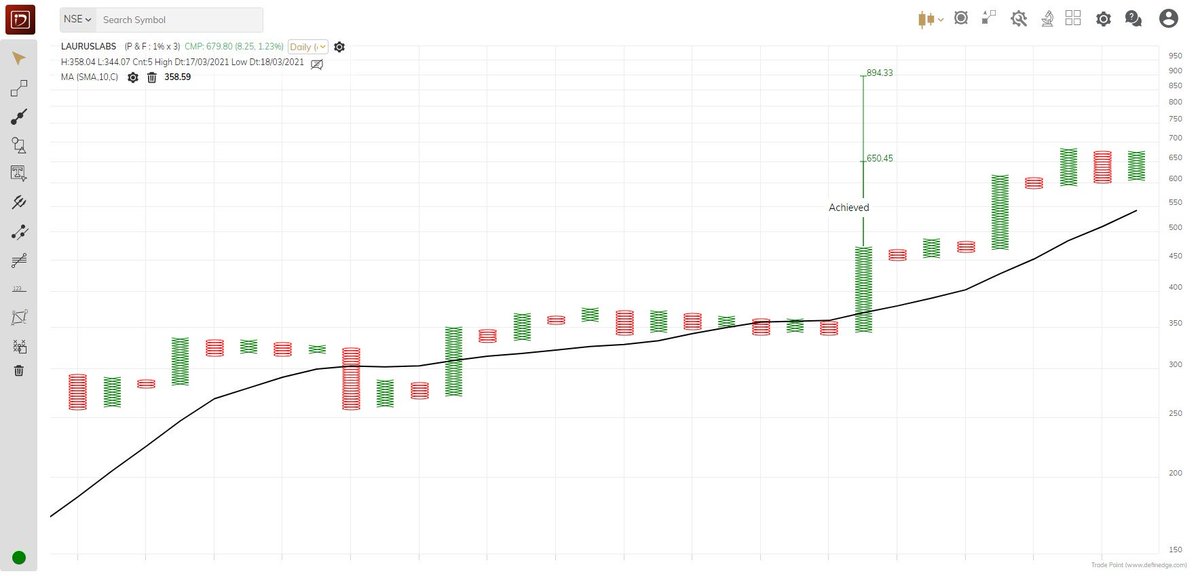
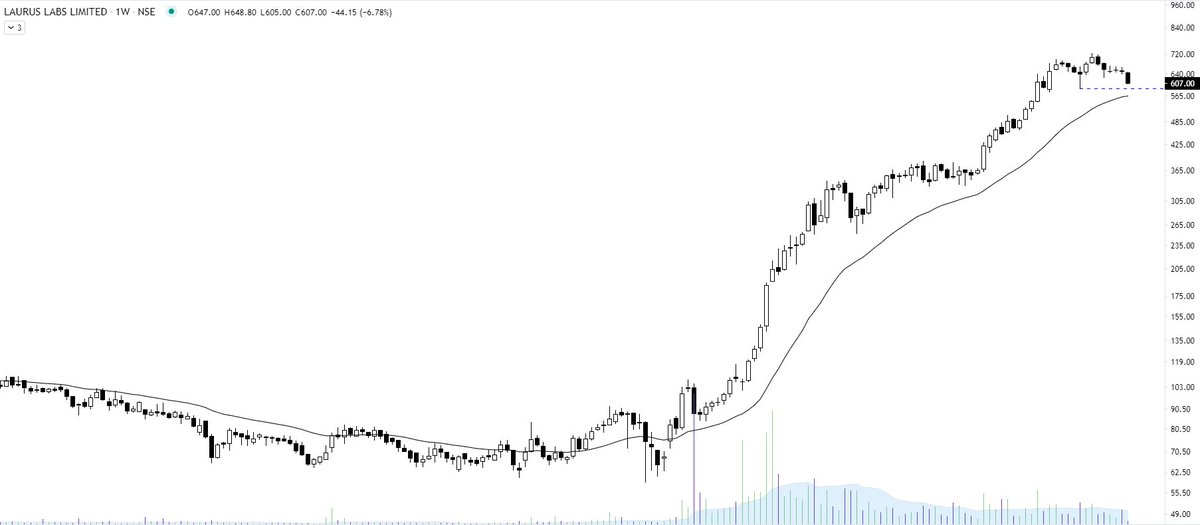
Laurus Labs - I am waiting till 3:15 PM to get confirmation of closing above 700 to add more of it in my portfolio. \u2705\u2705 pic.twitter.com/UxZCuxhuIX
— Steve Nison (@nison_steve) August 9, 2021
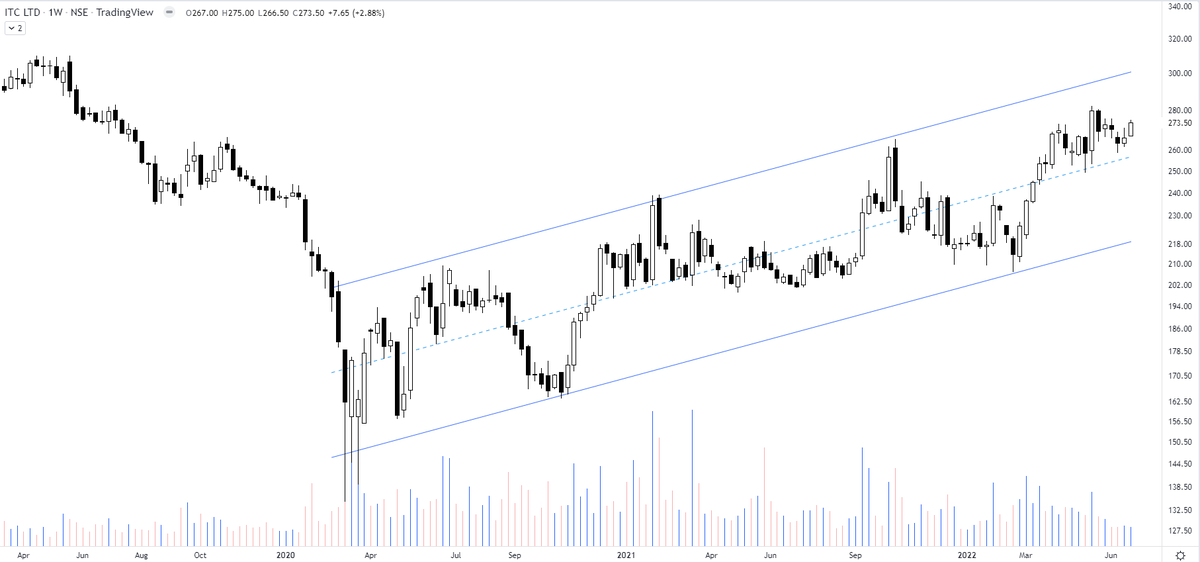
ITC - how beautifully the price patterns work. All of a sudden an increased momentum right from the support of the channel boundary. Has a minor resistance to nail down in the middle.
— The_Chartist \U0001f4c8 (@charts_zone) March 18, 2022
Anyone observing it would have gone aggressive at lower end for a swing move pic.twitter.com/YqxkdFlJXQ
Nifty Private Bank https://t.co/BwG1DKhhLc
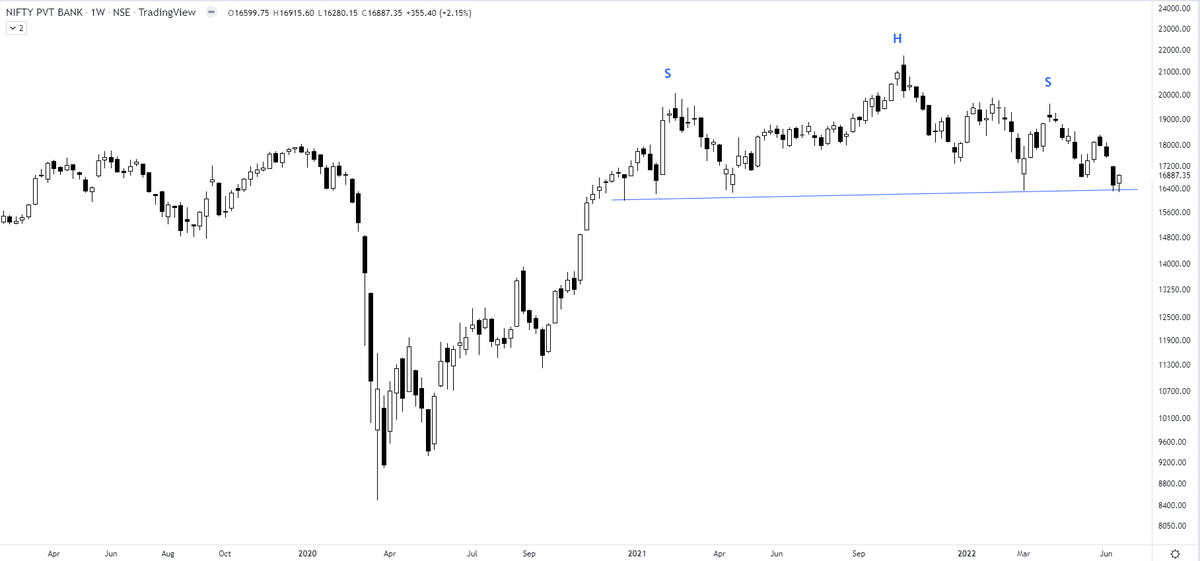
I am watching a big bearish H&S top building up in Nifty Private Bank Index. Any breakdown will result in increased volatility in respective charts. For traders - definitely not a spot to be in. The index has to move beyond 19900 to negate the pattern. pic.twitter.com/IGFeyNrtQV
— The_Chartist \U0001f4c8 (@charts_zone) June 19, 2022
More from Piindustries

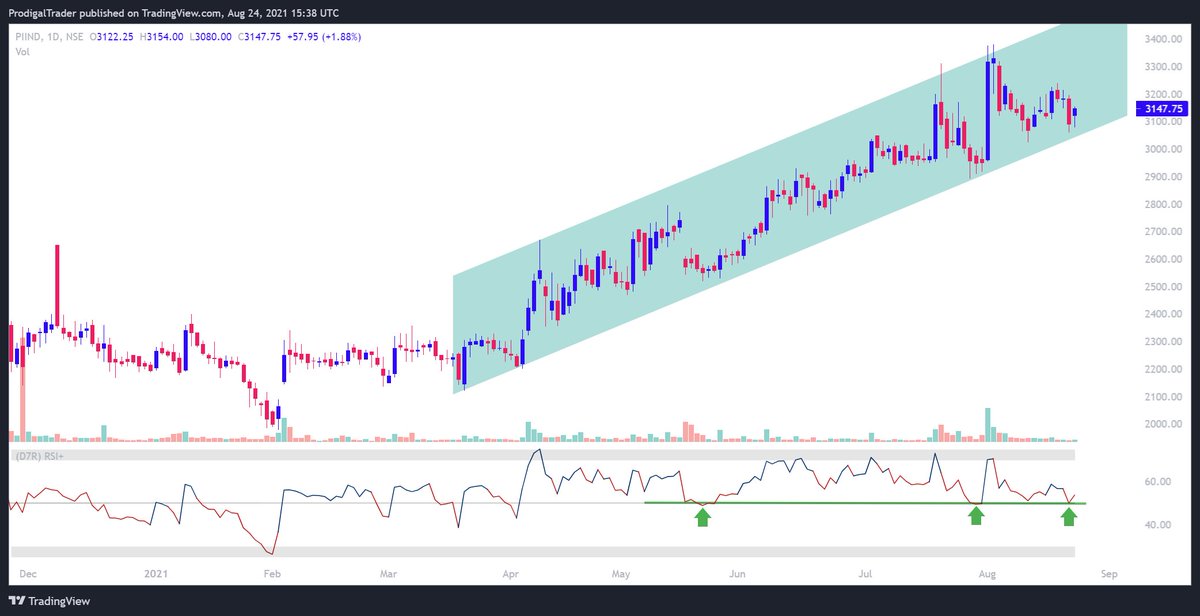


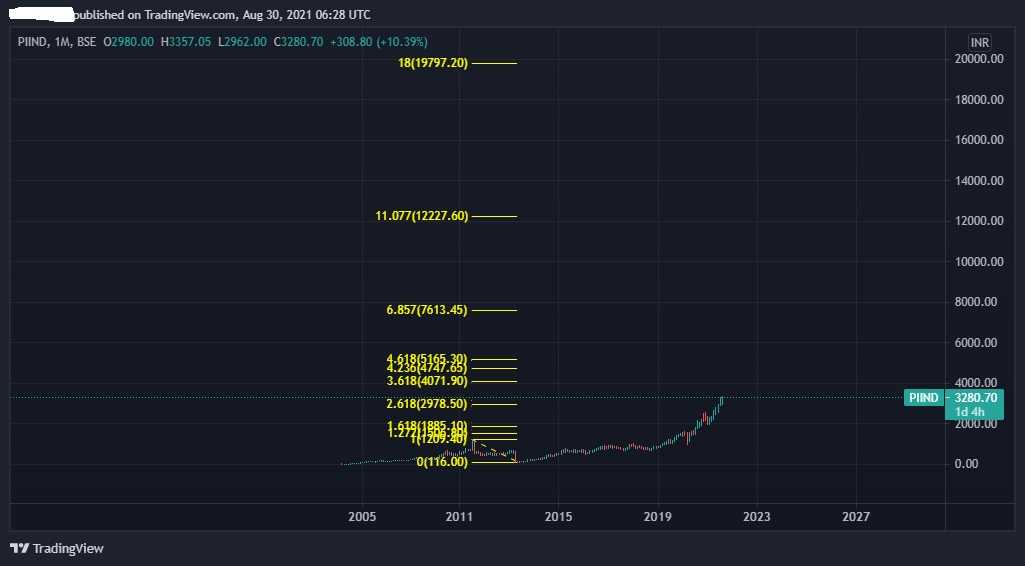


3147 to 3270
minor resustnce breakout now https://t.co/mcLJB7yEhO
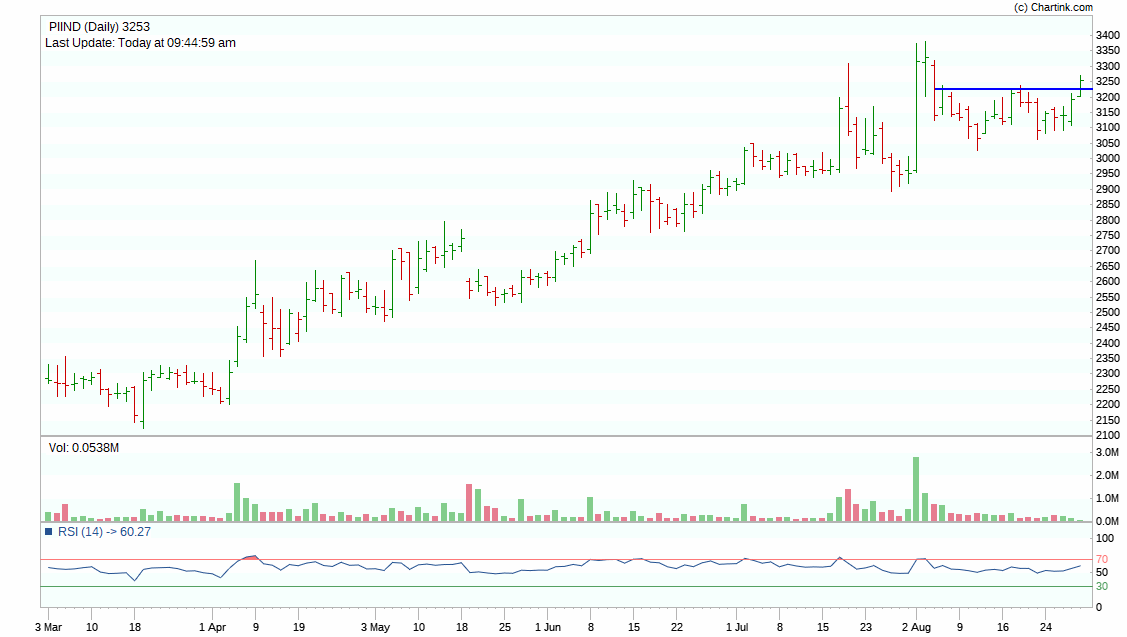
#piind
— ProdigalTrader (@ProdigalTrader) August 24, 2021
price at the bottom of a bullish channel with RSI showing clue son potetntial reversal here. Volume is dried up in pullback showing lack of supply#StockMarket #StocksInFocus #stocktrading #stockselection #stocktowatch pic.twitter.com/jpDOpnCzFu