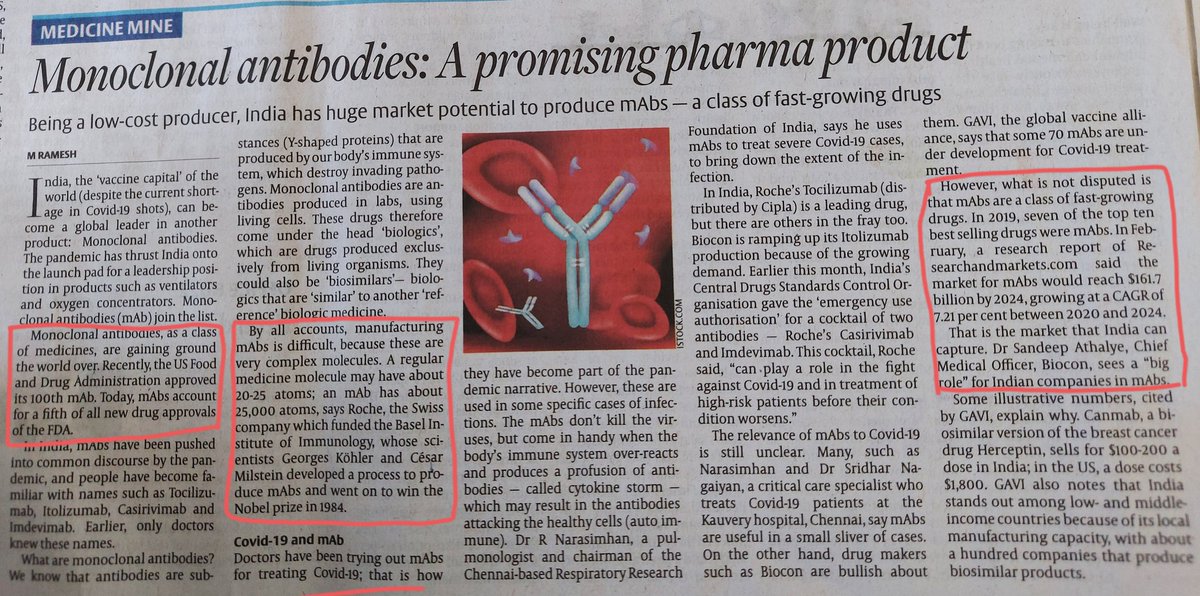
A good read on Monoclonal antibodies (mAbs) and their potential. @unseenvalue @punitbansal14 Would you like to add something on the future of mAbs in pharma industry.
More from Pharma





You May Also Like


This is a pretty valiant attempt to defend the "Feminist Glaciology" article, which says conventional wisdom is wrong, and this is a solid piece of scholarship. I'll beg to differ, because I think Jeffery, here, is confusing scholarship with "saying things that seem right".
The article is, at heart, deeply weird, even essentialist. Here, for example, is the claim that proposing climate engineering is a "man" thing. Also a "man" thing: attempting to get distance from a topic, approaching it in a disinterested fashion.

Also a "man" thing—physical courage. (I guess, not quite: physical courage "co-constitutes" masculinist glaciology along with nationalism and colonialism.)

There's criticism of a New York Times article that talks about glaciology adventures, which makes a similar point.

At the heart of this chunk is the claim that glaciology excludes women because of a narrative of scientific objectivity and physical adventure. This is a strong claim! It's not enough to say, hey, sure, sounds good. Is it true?
Imagine for a moment the most obscurantist, jargon-filled, po-mo article the politically correct academy might produce. Pure SJW nonsense. Got it? Chances are you're imagining something like the infamous "Feminist Glaciology" article from a few years back.https://t.co/NRaWNREBvR pic.twitter.com/qtSFBYY80S
— Jeffrey Sachs (@JeffreyASachs) October 13, 2018
The article is, at heart, deeply weird, even essentialist. Here, for example, is the claim that proposing climate engineering is a "man" thing. Also a "man" thing: attempting to get distance from a topic, approaching it in a disinterested fashion.
Also a "man" thing—physical courage. (I guess, not quite: physical courage "co-constitutes" masculinist glaciology along with nationalism and colonialism.)
There's criticism of a New York Times article that talks about glaciology adventures, which makes a similar point.
At the heart of this chunk is the claim that glaciology excludes women because of a narrative of scientific objectivity and physical adventure. This is a strong claim! It's not enough to say, hey, sure, sounds good. Is it true?