#LAURUSLABS Update
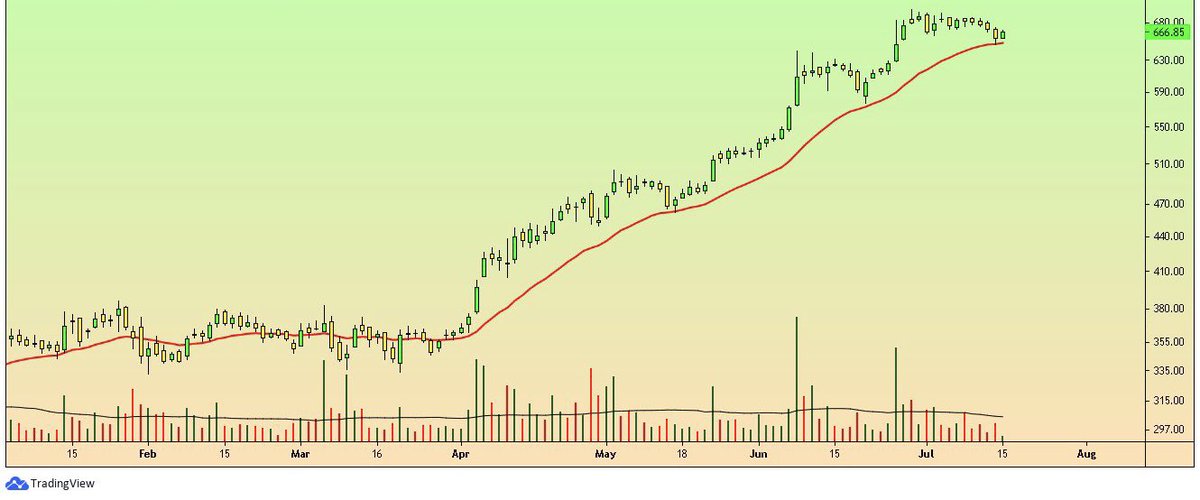
Into a narrow consolidation band post breakout.
Sustained above the zone, Target's intact.
#StockMarket #StocksInFocus https://t.co/lhfemwd4iQ
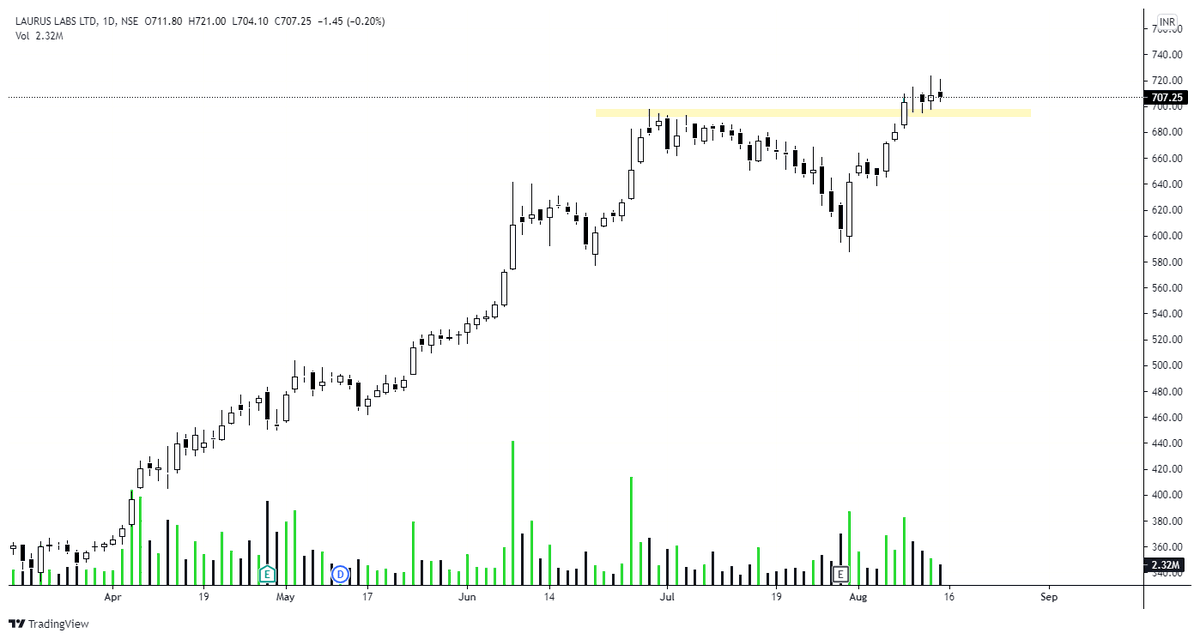
#LAURUSLABS Multiple TF Analysis
— Gurleen (@GurleenKaur_19) August 9, 2021
A break-through at ATH.
Sustenance above 698 and a breakout at 705.85 would bring in higher targets of 733 followed by 800 in short term. #StockMarket #StocksToWatch pic.twitter.com/2aaY3BG99D
More from Gurleen
Midway resistances held up strong.
Once these are breached, It is poised for more towards 1950 followed by 2000.
#StockMarket #StocksInFocus https://t.co/kswtnvjQM8
#KOTAKBANK
— Gurleen (@GurleenKaur_19) August 8, 2021
In daily; Trendline breakout along with price volume action.
Resistances midway at 1812.70 and 1856.75.
Once these are breached, It is poised for more towards 1950 followed by 2000.
In weekly as well; Setup looks quite bullish. #StockMarket #StocksToTrade pic.twitter.com/vfIjR7MuCE
More from Lauruslabs
Haters are gonna hate, but IMO, this is the best opportunity to start pyramiding and make it a well sized holding.
A trio of patterns coming together, has one of the highest success rate!
Double Top Buy, T20 Pattern - Bullish & Super pattern - Bullish above 477.81! https://t.co/SqzkTyb9wx
LAURUSLABS
— Saket Reddy (@saketreddy) December 17, 2020
There was no entry in Oct as the stock didn't close above 340.
Don't chase & don't buy it for short term.
Now, DTB above 348.15 daily close (Now trading at similar levels).
Wait for close above it or check if it's above the trigger price after 15:20 and enter. https://t.co/vh5hZpjJER pic.twitter.com/EprcgeLSqb
You May Also Like
This New York Times feature shows China with a Gini Index of less than 30, which would make it more equal than Canada, France, or the Netherlands. https://t.co/g3Sv6DZTDE
That's weird. Income inequality in China is legendary.
Let's check this number.
2/The New York Times cites the World Bank's recent report, "Fair Progress? Economic Mobility across Generations Around the World".
The report is available here:
3/The World Bank report has a graph in which it appears to show the same value for China's Gini - under 0.3.
The graph cites the World Development Indicators as its source for the income inequality data.
4/The World Development Indicators are available at the World Bank's website.
Here's the Gini index: https://t.co/MvylQzpX6A
It looks as if the latest estimate for China's Gini is 42.2.
That estimate is from 2012.
5/A Gini of 42.2 would put China in the same neighborhood as the U.S., whose Gini was estimated at 41 in 2013.
I can't find the <30 number anywhere. The only other estimate in the tables for China is from 2008, when it was estimated at 42.8.