
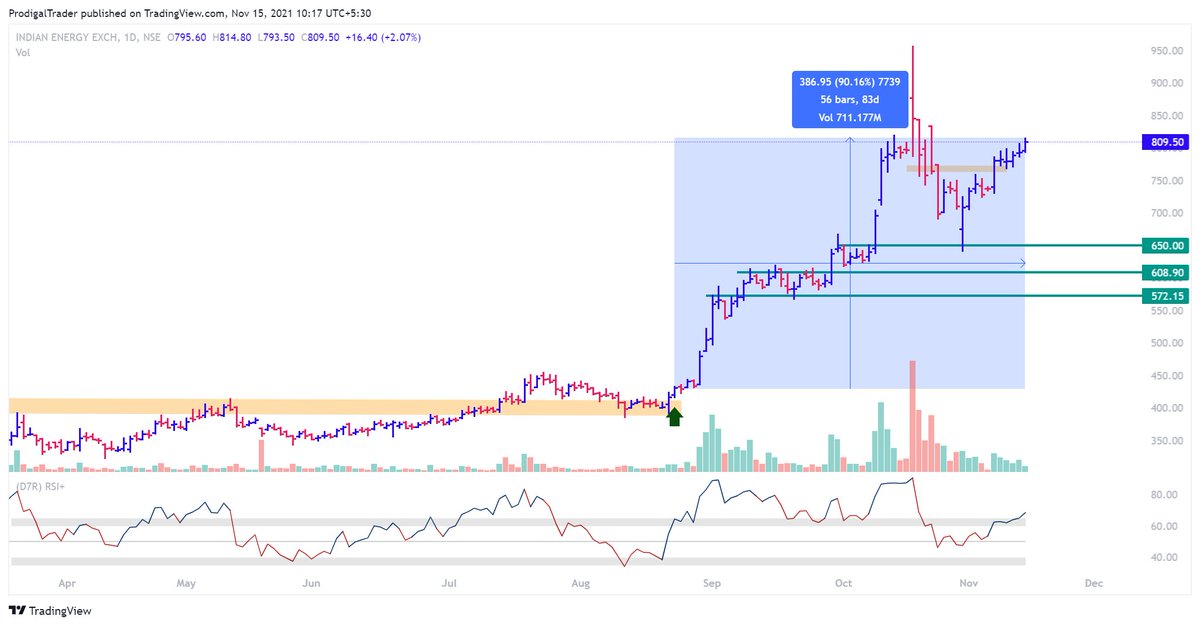
#IEX
90% in 56 days https://t.co/KAsBVxzlxb
#IEX
— Aneesh Philomina Antony (ProdigalTrader) (@ProdigalTrader) August 24, 2021
reversal of polarity played out very well here. Strong momentum and demand here pushing price up. Might breakout to new highs soon#StockMarket #StocksInFocus #stocktrading #stockselection #StockToWatch pic.twitter.com/oOnpBOfaNa
More from Aneesh Philomina Antony (ProdigalTrader)


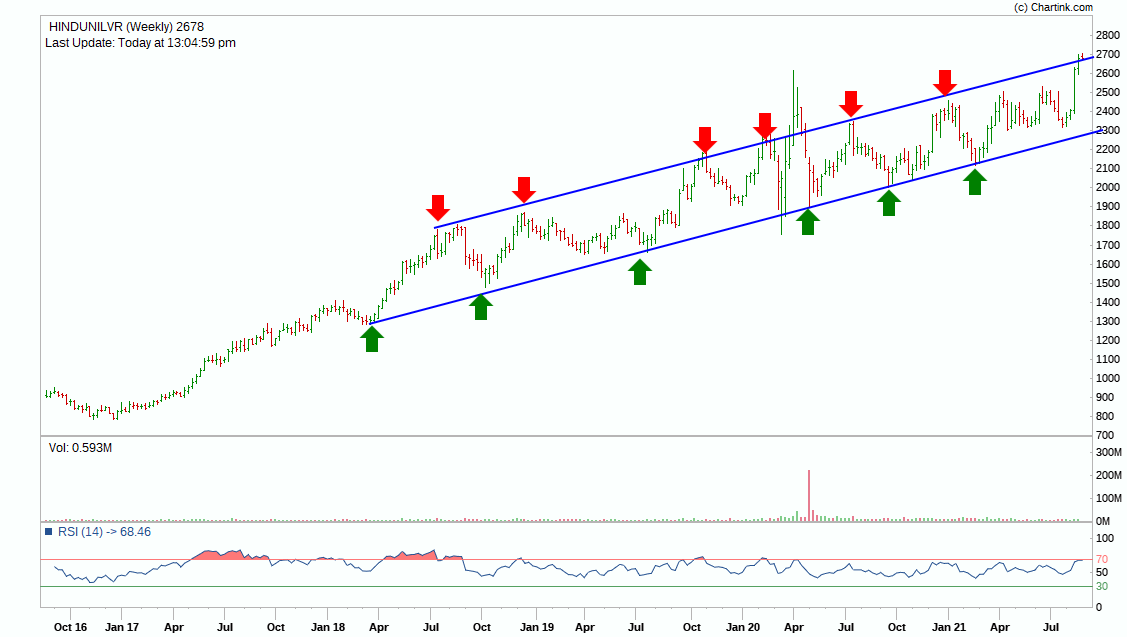
RSI is an oscillator which is set to fluctuate between 0 and 100. Adding an MA to it would give a perspective of its location, at the max. Its never support or resistance
Aneesh ji, Like in PA we have undercut and reclaim of some major MA some significance, does it have any significance in RSI?
— Prakhar (@StocksbyPrakhar) May 12, 2022
More from Iex


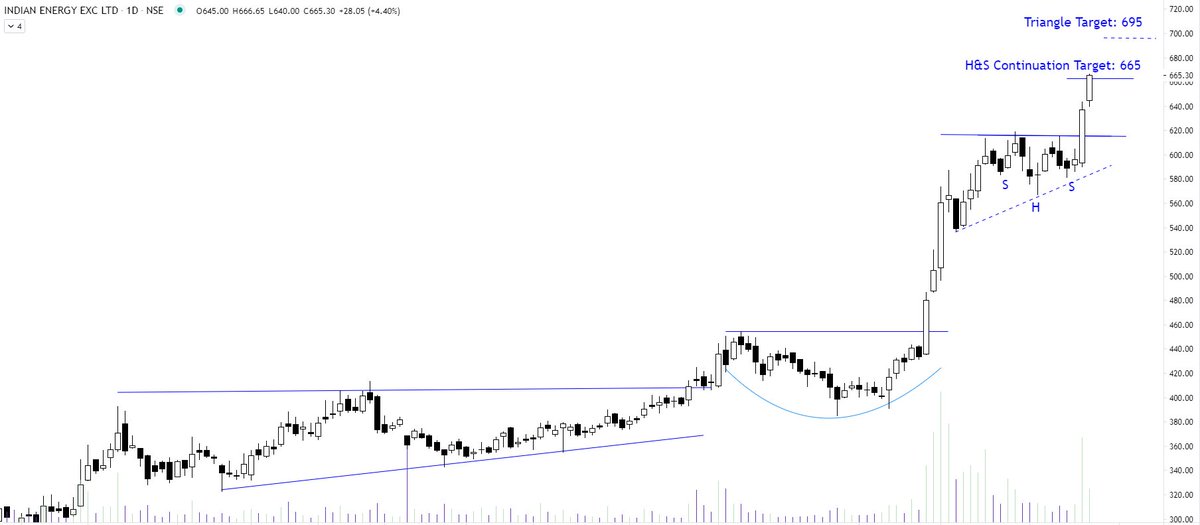
Indian Energy Exchange (IEX) - hope what I wrote would help you to change your psychology. Ride the winners without any bias with a proper SL in place.
Updated chart https://t.co/GABkSthg5L
Updated chart https://t.co/GABkSthg5L
Indian Energy Exchange (IEX) - because you missed the 1st BO maybe at 200/300/400/500 therefore, your brain will keep on saying you - "now it is expensive" but it will keep on going up troubling you more. Perfect trait of a marathon runner. Follow the price with SL. pic.twitter.com/cKH3vnG05l
— The_Chartist \U0001f4c8 (@nison_steve) September 28, 2021


![Peter McCormack [Jan/3\u279e\u20bf \U0001f511\u220e]](https://pbs.twimg.com/profile_images/1524287442307723265/_59ITDbJ_normal.jpg)


