
12 things you should look out for before buying health insurance
A thread 🧵
You have to be a little wary of policies that come with co-pay. With co-pay, you need to pay a pre-decided amount from your own pocket whenever you make a claim.
The larger your expenses, the larger you’ll end up spending your own money, even with insurance.
This is something you need to be conscious of when making choices during hospitalization. Let’s deep dive into what will happen if your policy doesn’t have a room rent limit and when it does.
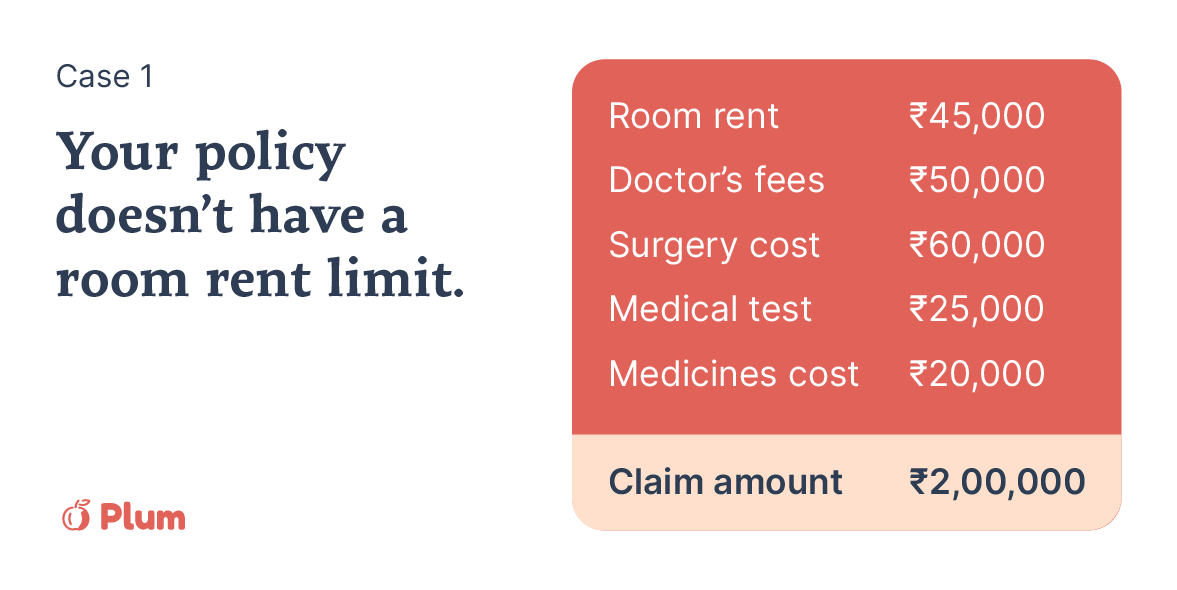
You have a health insurance cover of ₹15 lakhs, with *no room-rent limit*. You get treated for a condition that costs you ₹2 lakhs, and you paid ₹15,000 in room rent per day.
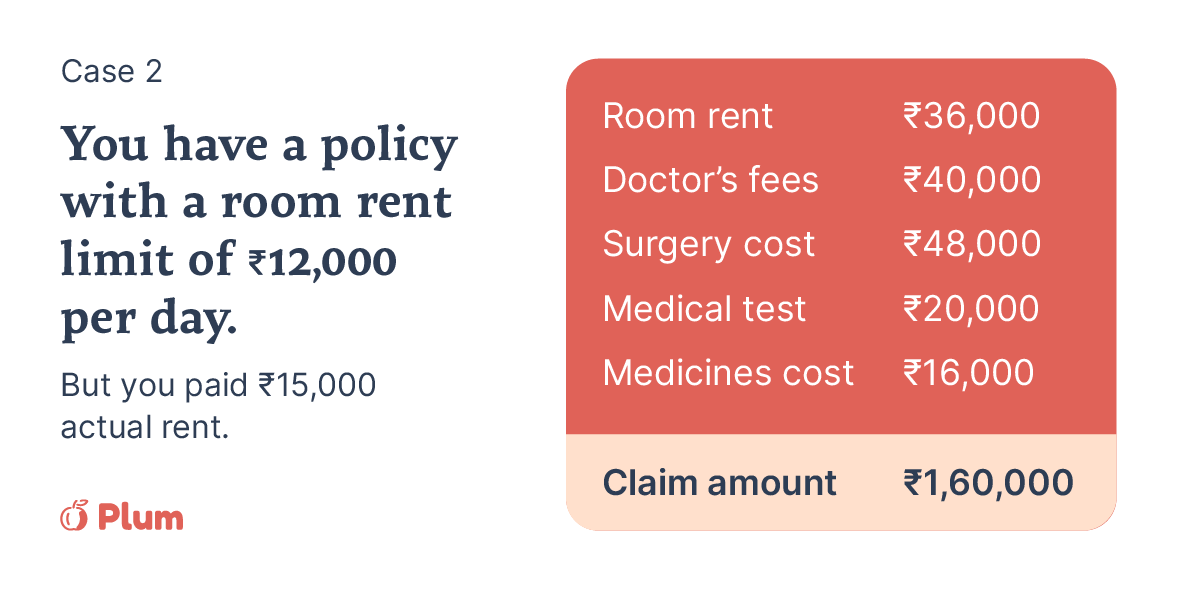
You have a health insurance cover of ₹15 lakhs, with a room rent limit of ₹12,000 per day. You get treated for a condition that costs you ₹2 lakhs, but you stayed in a room that costs you ₹15,000/day.
In this case, each component in your cost is proportionately deducted (12/15*cost), and therefore, you can only claim ₹1,60,000 of your total expenditure.
Check the attached image to understand how your claim amount gets reduced.
You might have thought the room rent doesn't matter as much - but it does.
During this period after you purchase a policy, you cannot make any claim. It’s typically between 30 to 90 days. This waiting period is waived in the event of an accident that leads to immediate hospitalization.
This applies to pre-existing diseases (like diabetes) present when a health insurance policy is bought. The insurer will accept your claims for treatment related to these diseases only if the waiting period you agreed upon has passed.
This means that the insurer applies a limit on the amount you can claim for treatments for specified conditions and diseases.
Save yourself that shock by going through the rest of this thread and also bookmarking it :)
After you buy a policy, you can cancel it within a certain free-look period, stating your reasons.
However, the insurer will not refund any medical tests, stamp duty charges done during this period.
The free-look period is typically 15 to 30 days.
This is the facility given by the insurer to you, for covering your pre and post-hospitalization expenses.
This will go a long way in saving you a lot of money (and stress!)
This means single-day treatments like eye surgery, etc. are covered by your health insurance policy.
Several common treatments require single day hospitalization, so you need to totally make sure that these are covered.
If you don't make any claim in a year, the insurer will reward you by increasing your coverage amount (with a max limit).
No claim bonuses are good-to-have on your policy.
If your policy has a domiciliary cover (quite some insurance-speak!), it means that you can claim money when you are treated at home.
This is great during these times because it’s really difficult to find hospital beds during the pandemic.
If you’ve completed 8 years of coverage, the insurer cannot reject an eligible claim, for any reason except for proven frauds and exclusions made in the policy documents.
If you spot these words, it means the insurance company provides you with a free health check-up.
More from Health


You May Also Like


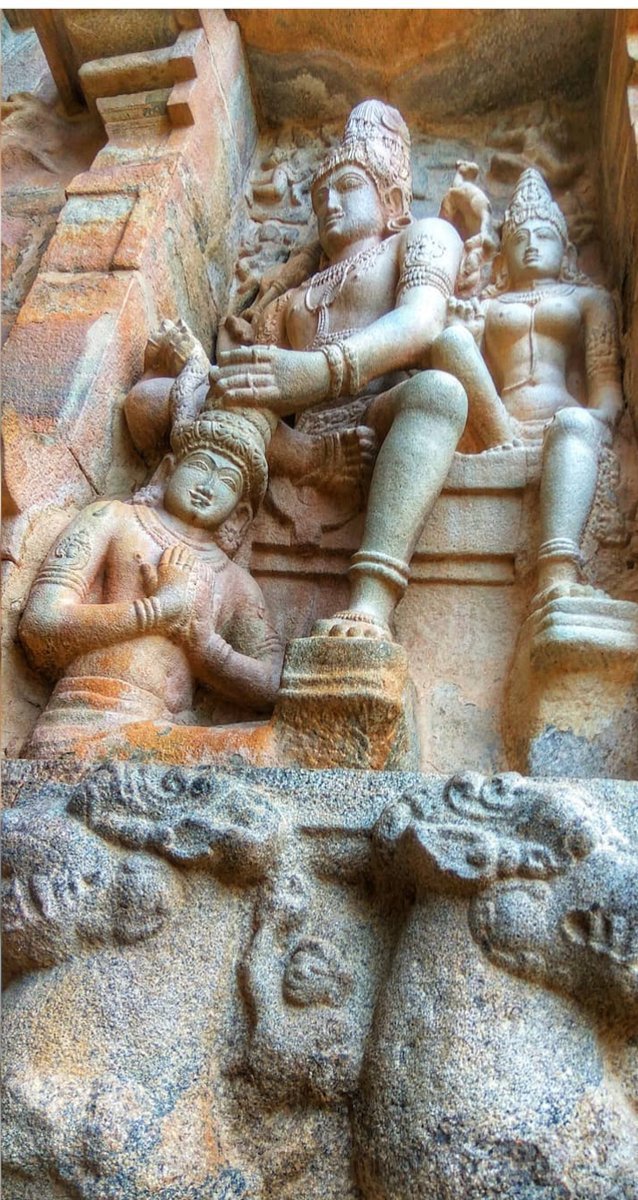
#sculpture #story -
Chandesha-Anugraha Murti - One of the Sculpture in Brihadeshwara Temple at Gangaikonda Cholapuram - built by Raja Rajendra Chola I
This Sculpture depicts Bhagwan Shiva along with Devi Paravathi blessing Chandeshwara - one of the 63 Nayanmars.
#Thread
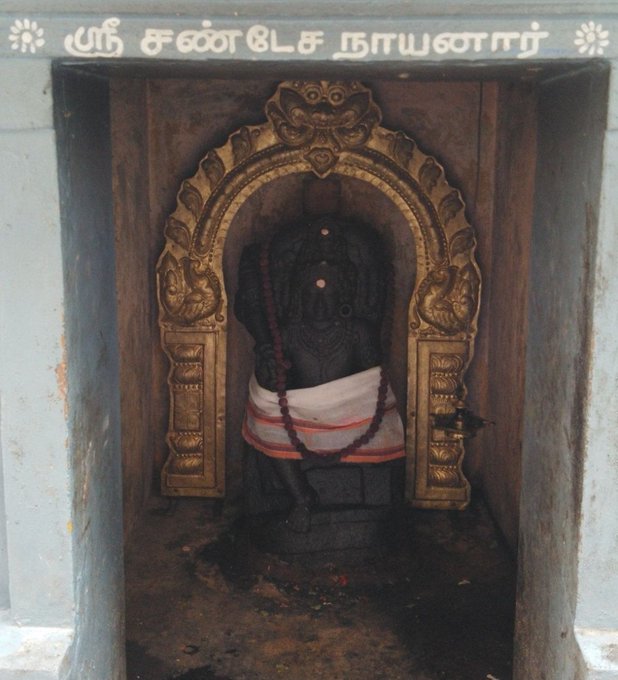
Chandeshwara/Chandikeshwara is regarded as custodian of Shiva Temple's wealth&most of Shiva temples in South India has separate sannathi for him.
His bhakti for Bhagwan Shiva elevated him as one of foremost among Nayanmars.
He gave importance to Shiva Pooja&protection of cows.
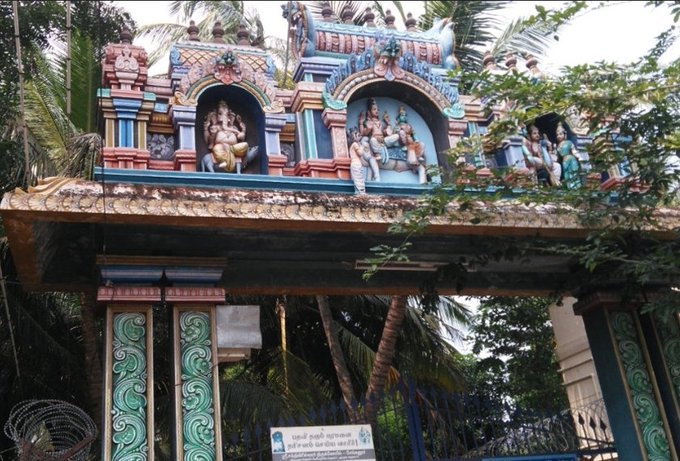
There are series of paintings, illustrating the #story of Chandikeshwar in the premises of
Sri Sathiyagireeswarar #Temple at Seinganur,near Kumbakonam,TN
Chandikeshwara's birth name
is Vichara sarman.He was born in the village of Senganur on the banks of River Manni.
His Parent names were Yajnathatan and Pavithrai.
Vichara Sarman was a gifted child and he learnt Vedas and Agamas at a very young age.
He was very devout and would always think about Bhagwan Shiva.
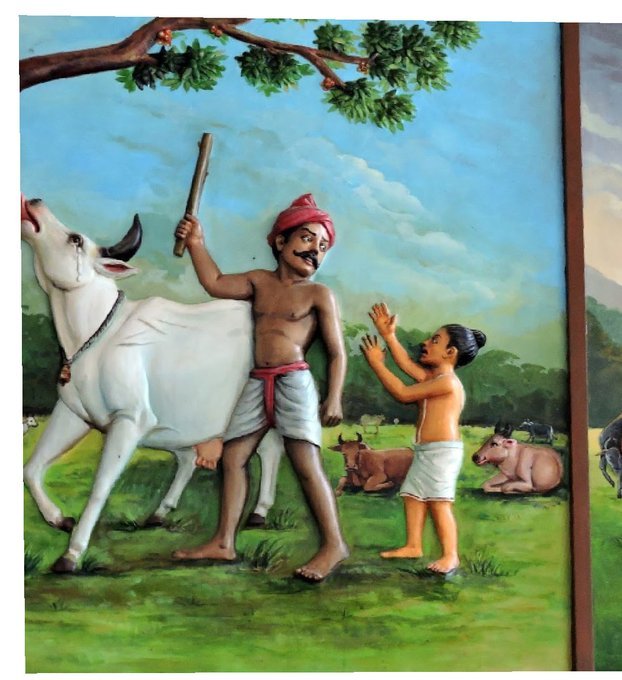
One day he saw a cowherd man brutally assaulting a cow,Vichara Sarman could not tolerate this. He spoke to cowherd: ‘Do you not know that the cow is worshipful & divine? All gods & Devas reside in https://t.co/ElLcI5ppsK it is our duty to protect cows &we should not to harm them.
Chandesha-Anugraha Murti - One of the Sculpture in Brihadeshwara Temple at Gangaikonda Cholapuram - built by Raja Rajendra Chola I
This Sculpture depicts Bhagwan Shiva along with Devi Paravathi blessing Chandeshwara - one of the 63 Nayanmars.
#Thread
Chandeshwara/Chandikeshwara is regarded as custodian of Shiva Temple's wealth&most of Shiva temples in South India has separate sannathi for him.
His bhakti for Bhagwan Shiva elevated him as one of foremost among Nayanmars.
He gave importance to Shiva Pooja&protection of cows.
There are series of paintings, illustrating the #story of Chandikeshwar in the premises of
Sri Sathiyagireeswarar #Temple at Seinganur,near Kumbakonam,TN
Chandikeshwara's birth name
is Vichara sarman.He was born in the village of Senganur on the banks of River Manni.
His Parent names were Yajnathatan and Pavithrai.
Vichara Sarman was a gifted child and he learnt Vedas and Agamas at a very young age.
He was very devout and would always think about Bhagwan Shiva.
One day he saw a cowherd man brutally assaulting a cow,Vichara Sarman could not tolerate this. He spoke to cowherd: ‘Do you not know that the cow is worshipful & divine? All gods & Devas reside in https://t.co/ElLcI5ppsK it is our duty to protect cows &we should not to harm them.


Department List of UCAS-China PROFESSORs for ANSO, CSC and UCAS (fully or partial) Scholarship Acceptance
1) UCAS School of physical sciences Professor
https://t.co/9X8OheIvRw
2) UCAS School of mathematical sciences Professor
3) UCAS School of nuclear sciences and technology
https://t.co/nQH8JnewcJ
4) UCAS School of astronomy and space sciences
https://t.co/7Ikc6CuKHZ
5) UCAS School of engineering
6) Geotechnical Engineering Teaching and Research Office
https://t.co/jBCJW7UKlQ
7) Multi-scale Mechanics Teaching and Research Section
https://t.co/eqfQnX1LEQ
😎 Microgravity Science Teaching and Research
9) High temperature gas dynamics teaching and research section
https://t.co/tVIdKgTPl3
10) Department of Biomechanics and Medical Engineering
https://t.co/ubW4xhZY2R
11) Ocean Engineering Teaching and Research
12) Department of Dynamics and Advanced Manufacturing
https://t.co/42BKXEugGv
13) Refrigeration and Cryogenic Engineering Teaching and Research Office
https://t.co/pZdUXFTvw3
14) Power Machinery and Engineering Teaching and Research