
Every AMERICAN should want FREE & FAIR elections and NO TRAITORS inside our government.
For 4 YEARS the traitors have been exposed and there's been NO JUSTICE yet leaders call for PEACE as Nation descends into the hands of the ENEMY who are openly talking about HUNTING AMERICANS
More from ⚡️🇺🇸⚖️Todd Doyle⚖️🇺🇸⚡️
More from Government


You May Also Like


@NBA @StephenKissler @yhgrad 1. From Day 1, SARS-COV-2 was very well adapted to humans .....and transgenic hACE2 Mice
1. From Day 1, SARS-COV-2 was very well adapted to humans .....and transgenic hACE2 Mice
— Billy Bostickson \U0001f3f4\U0001f441&\U0001f441 \U0001f193 (@BillyBostickson) January 30, 2021
"we generated a mouse model expressing hACE2 by using CRISPR/Cas9 knockin technology. In comparison with wild-type C57BL/6 mice, both young & aged hACE2 mice sustained high viral loads... pic.twitter.com/j94XtSkscj
@NBA @StephenKissler @yhgrad 2. High Probability of serial passaging in Transgenic Mice expressing hACE2 in genesis of SARS-COV-2
1. High Probability of serial passaging in Transgenic Mice expressing hACE2 in genesis of SARS-COV-2!
— Billy Bostickson \U0001f3f4\U0001f441&\U0001f441 \U0001f193 (@BillyBostickson) January 2, 2021
2 papers:
Human\u2013viral molecular mimicryhttps://t.co/irfH0Zgrve
Molecular Mimicryhttps://t.co/yLQoUtfS6s https://t.co/lsCv2iMEQz
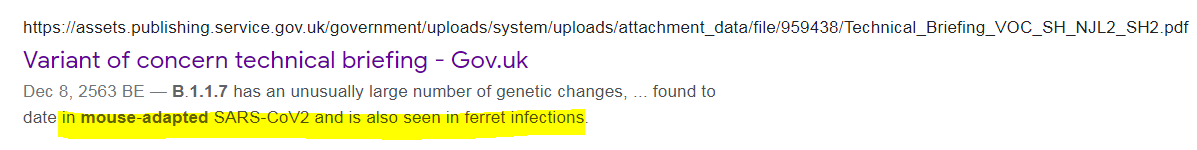
@NBA @StephenKissler @yhgrad B.1.1.7 has an unusually large number of genetic changes, ... found to date in mouse-adapted SARS-CoV2 and is also seen in ferret infections.
https://t.co/9Z4oJmkcKj
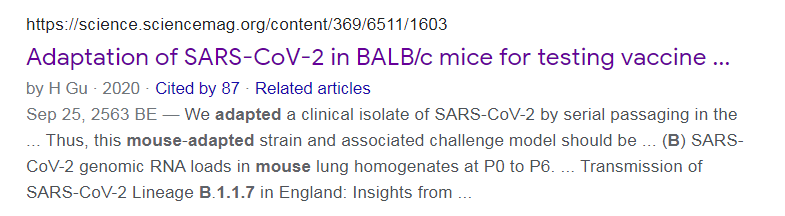
@NBA @StephenKissler @yhgrad We adapted a clinical isolate of SARS-CoV-2 by serial passaging in the ... Thus, this mouse-adapted strain and associated challenge model should be ... (B) SARS-CoV-2 genomic RNA loads in mouse lung homogenates at P0 to P6.
https://t.co/I90OOCJg7o

A thread 👇
https://t.co/xj4js6shhy
Entrepreneur\u2019s mind.
— James Clear (@JamesClear) August 22, 2020
Athlete\u2019s body.
Artist\u2019s soul.
https://t.co/b81zoW6u1d
When you choose who to follow on Twitter, you are choosing your future thoughts.
— James Clear (@JamesClear) October 3, 2020
https://t.co/1147it02zs
Working on a problem reduces the fear of it.
— James Clear (@JamesClear) August 30, 2020
It\u2019s hard to fear a problem when you are making progress on it\u2014even if progress is imperfect and slow.
Action relieves anxiety.
https://t.co/A7XCU5fC2m
We often avoid taking action because we think "I need to learn more," but the best way to learn is often by taking action.
— James Clear (@JamesClear) September 23, 2020