
👀 👇🏼 saving all these post from Lin Wood in this thread.
As background to tweets I am about to post, you should read this article carefully. I ask that you read each of my tweets carefully & decide if the information conveyed demands that Patriots rise up so that every lie will be revealed.@realDonaldTrumphttps://t.co/9KIX4DEtha
— Lin Wood (@LLinWood) January 4, 2021
More from Government


'Peaceful transition to Military Power....'
Cannon
44
....heard around the world
NG - High Alert https://t.co/lfeSiUCCRB

We Will Never Forget
44
Stage is set
https://t.co/h6G3LCevII

Following the 44 trail of breadrumbs
https://t.co/PcX0uKUEUW
Cannon
44
....heard around the world
NG - High Alert https://t.co/lfeSiUCCRB
\U0001f4a5 BOOM \U0001f4a5
— R\u0113d.P\u012bll.Ph\u0101rm\u0101c\u012bst (@Red_Pill_Pharma) January 18, 2021
30 secs in - what do I hear?
\u2018Peaceful transition to military power\u2019
\U0001f1fa\U0001f1f8 MILITARY IS THE ONLY WAY \U0001f1fa\U0001f1f8 pic.twitter.com/9NPMT7N7Qy
We Will Never Forget
44
Stage is set
https://t.co/h6G3LCevII
The stage is set. Staged.
— JeLove (@LovesTheLight) November 7, 2020
Where? (the) Delaware.
10:44
Purple
First graphic in 98https://t.co/PKHlxp0rzS pic.twitter.com/XCx6pVQTHx
Following the 44 trail of breadrumbs
https://t.co/PcX0uKUEUW
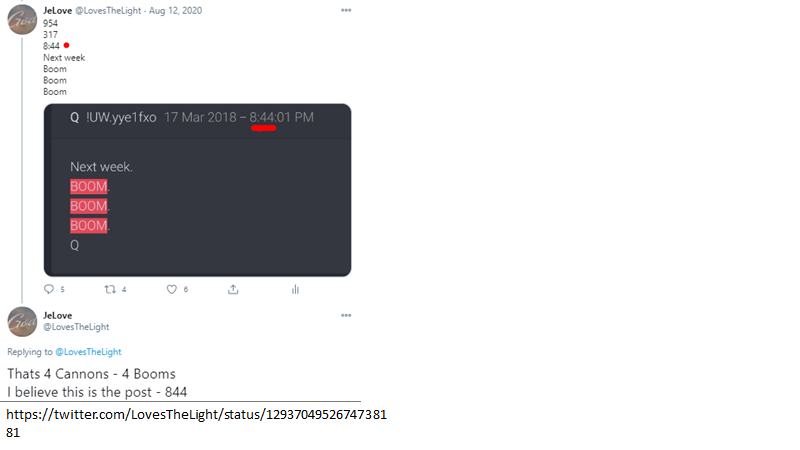
Boom, Boom, Boom pic.twitter.com/ZcZXAgL0Qf
— JeLove (@LovesTheLight) August 13, 2020


You May Also Like


On the occasion of youtube 20k and Twitter 70k members
A small tribute/gift to members
Screeners
technical screeners - intraday and positional both
before proceeding - i have helped you , can i ask you so that it can help someone else too
thank you
positional one
run - find #stock - draw chart - find levels
1- Stocks closing daily 2% up from 5 days
https://t.co/gTZrYY3Nht
2- Weekly breakout
https://t.co/1f4ahEolYB
3- Breakouts in short term
https://t.co/BI4h0CdgO2
4- Bullish from last 5
intraday screeners
5- 15 minute Stock Breakouts
https://t.co/9eAo82iuNv
6- Intraday Buying seen in the past 15 minutes
https://t.co/XqAJKhLB5G
7- Stocks trading near day's high on 5 min chart with volume BO intraday
https://t.co/flHmm6QXmo
Thank you


1/OK, data mystery time.
This New York Times feature shows China with a Gini Index of less than 30, which would make it more equal than Canada, France, or the Netherlands. https://t.co/g3Sv6DZTDE
That's weird. Income inequality in China is legendary.
Let's check this number.
2/The New York Times cites the World Bank's recent report, "Fair Progress? Economic Mobility across Generations Around the World".
The report is available here:
3/The World Bank report has a graph in which it appears to show the same value for China's Gini - under 0.3.
The graph cites the World Development Indicators as its source for the income inequality data.

4/The World Development Indicators are available at the World Bank's website.
Here's the Gini index: https://t.co/MvylQzpX6A
It looks as if the latest estimate for China's Gini is 42.2.
That estimate is from 2012.
5/A Gini of 42.2 would put China in the same neighborhood as the U.S., whose Gini was estimated at 41 in 2013.
I can't find the <30 number anywhere. The only other estimate in the tables for China is from 2008, when it was estimated at 42.8.
This New York Times feature shows China with a Gini Index of less than 30, which would make it more equal than Canada, France, or the Netherlands. https://t.co/g3Sv6DZTDE
That's weird. Income inequality in China is legendary.
Let's check this number.
2/The New York Times cites the World Bank's recent report, "Fair Progress? Economic Mobility across Generations Around the World".
The report is available here:
3/The World Bank report has a graph in which it appears to show the same value for China's Gini - under 0.3.
The graph cites the World Development Indicators as its source for the income inequality data.
4/The World Development Indicators are available at the World Bank's website.
Here's the Gini index: https://t.co/MvylQzpX6A
It looks as if the latest estimate for China's Gini is 42.2.
That estimate is from 2012.
5/A Gini of 42.2 would put China in the same neighborhood as the U.S., whose Gini was estimated at 41 in 2013.
I can't find the <30 number anywhere. The only other estimate in the tables for China is from 2008, when it was estimated at 42.8.