More from Alok Jain ⚡


More from Gold


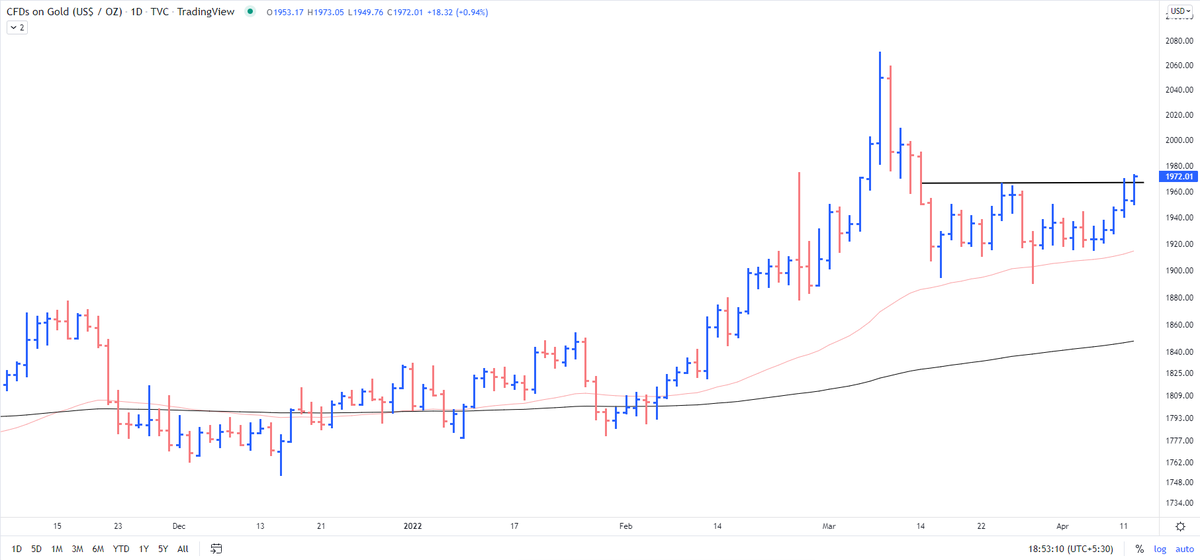
Fast forward to today when I added Gold at 1850. It made a sharp-up move but didn't want to sell for the sake of hedging. The positions were scaled up around 1925 with the fresh SL of 1900.
So far doing good. 2000 is the level I would be looking for. https://t.co/j1kiKRSx0y
So far doing good. 2000 is the level I would be looking for. https://t.co/j1kiKRSx0y
GOLD - 1 9 2 7 from 1 8 5 0
— The_Chartist \U0001f4c8 (@charts_zone) February 24, 2022
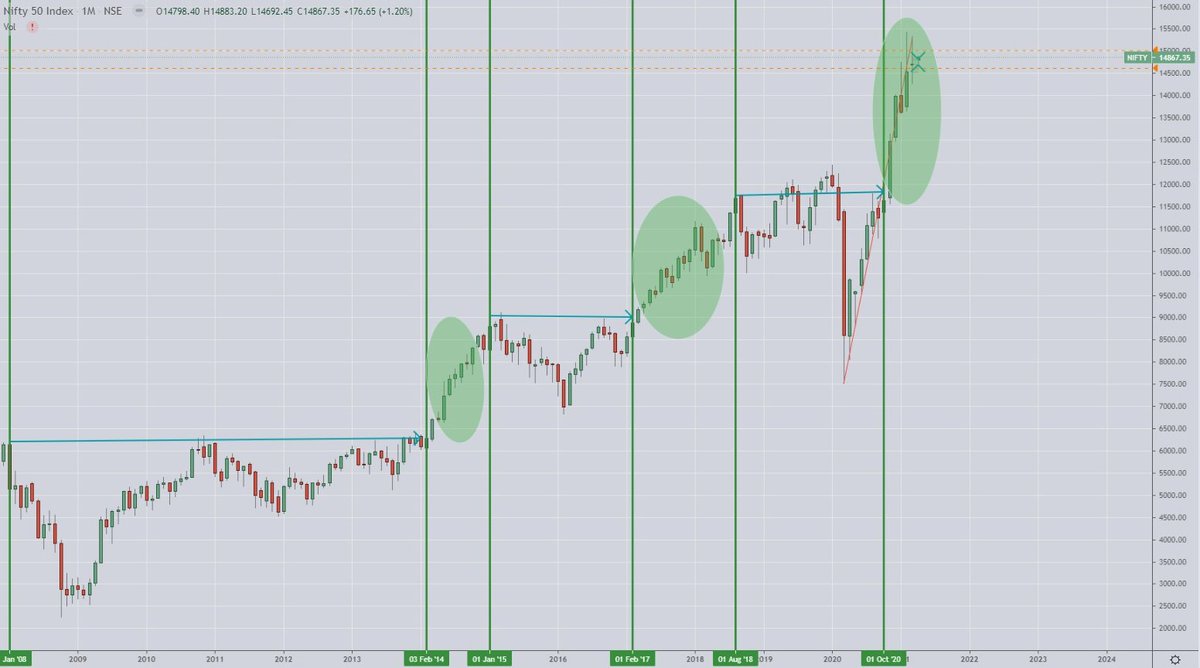
No indicators, nothing. Understand the language of the price. https://t.co/l6pEGD7r6D pic.twitter.com/JWZjlTLSBF