
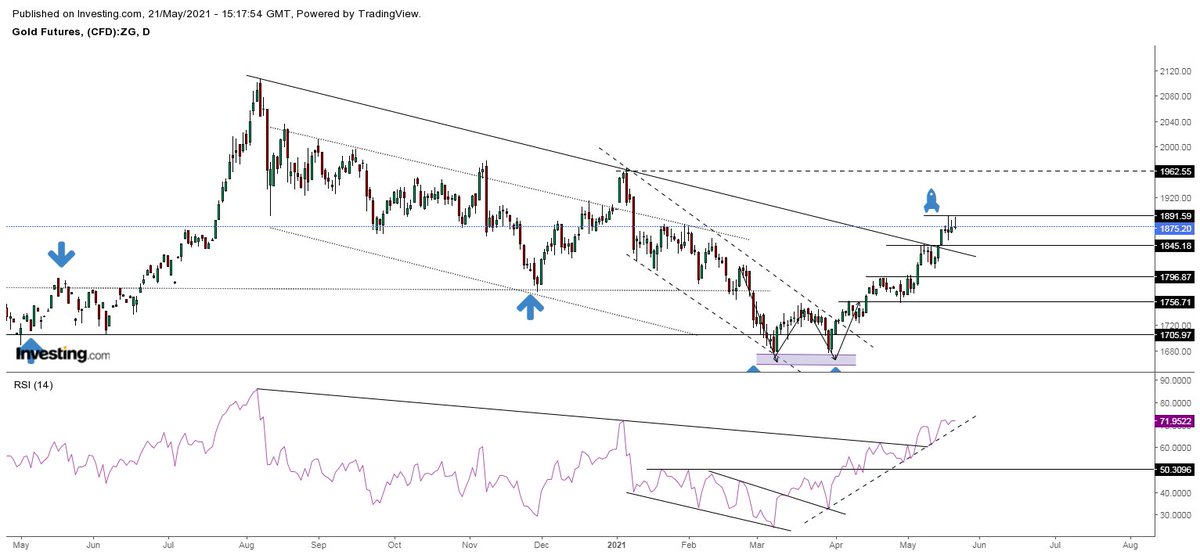
#GOLD$1800
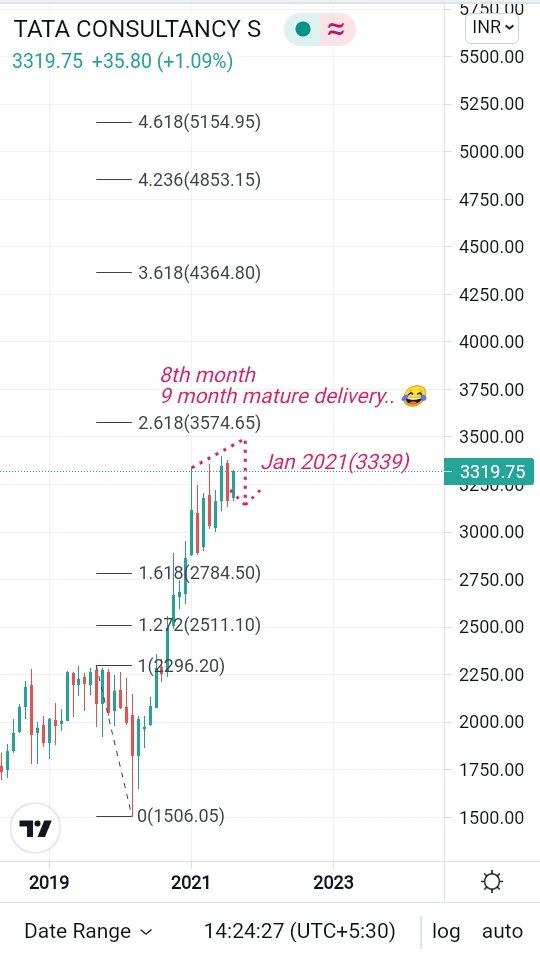
Monthly chart
Opportunity after decade ?
#MACD
#Probability
#Observation

More from MaRkET WaVES (DINESH PATEL ) Stock Market FARMER
More from Gold


You May Also Like


Great article from @AsheSchow. I lived thru the 'Satanic Panic' of the 1980's/early 1990's asking myself "Has eveyrbody lost their GODDAMN MINDS?!"
The 3 big things that made the 1980's/early 1990's surreal for me.
1) Satanic Panic - satanism in the day cares ahhhh!
2) "Repressed memory" syndrome
3) Facilitated Communication [FC]
All 3 led to massive abuse.
"Therapists" -and I use the term to describe these quacks loosely - would hypnotize people & convince they they were 'reliving' past memories of Mom & Dad killing babies in Satanic rituals in the basement while they were growing up.
Other 'therapists' would badger kids until they invented stories about watching alligators eat babies dropped into a lake from a hot air balloon. Kids would deny anything happened for hours until the therapist 'broke through' and 'found' the 'truth'.
FC was a movement that started with the claim severely handicapped individuals were able to 'type' legible sentences & communicate if a 'helper' guided their hands over a keyboard.
For three years I have wanted to write an article on moral panics. I have collected anecdotes and similarities between today\u2019s moral panic and those of the past - particularly the Satanic Panic of the 80s.
— Ashe Schow (@AsheSchow) September 29, 2018
This is my finished product: https://t.co/otcM1uuUDk
The 3 big things that made the 1980's/early 1990's surreal for me.
1) Satanic Panic - satanism in the day cares ahhhh!
2) "Repressed memory" syndrome
3) Facilitated Communication [FC]
All 3 led to massive abuse.
"Therapists" -and I use the term to describe these quacks loosely - would hypnotize people & convince they they were 'reliving' past memories of Mom & Dad killing babies in Satanic rituals in the basement while they were growing up.
Other 'therapists' would badger kids until they invented stories about watching alligators eat babies dropped into a lake from a hot air balloon. Kids would deny anything happened for hours until the therapist 'broke through' and 'found' the 'truth'.
FC was a movement that started with the claim severely handicapped individuals were able to 'type' legible sentences & communicate if a 'helper' guided their hands over a keyboard.

“We don’t negotiate salaries” is a negotiation tactic.
Always. No, your company is not an exception.
A tactic I don’t appreciate at all because of how unfairly it penalizes low-leverage, junior employees, and those loyal enough not to question it, but that’s negotiation for you after all. Weaponized information asymmetry.
Listen to Aditya
And by the way, you should never be worried that an offer would be withdrawn if you politely negotiate.
I have seen this happen *extremely* rarely, mostly to women, and anyway is a giant red flag. It suggests you probably didn’t want to work there.
You wish there was no negotiating so it would all be more fair? I feel you, but it’s not happening.
Instead, negotiate hard, use your privilege, and then go and share numbers with your underrepresented and underpaid colleagues. […]
Always. No, your company is not an exception.
A tactic I don’t appreciate at all because of how unfairly it penalizes low-leverage, junior employees, and those loyal enough not to question it, but that’s negotiation for you after all. Weaponized information asymmetry.
Listen to Aditya
"we don't negotiate salaries" really means "we'd prefer to negotiate massive signing bonuses and equity grants, but we'll negotiate salary if you REALLY insist" https://t.co/80k7nWAMoK
— Aditya Mukerjee, the Otterrific \U0001f3f3\ufe0f\u200d\U0001f308 (@chimeracoder) December 4, 2018
And by the way, you should never be worried that an offer would be withdrawn if you politely negotiate.
I have seen this happen *extremely* rarely, mostly to women, and anyway is a giant red flag. It suggests you probably didn’t want to work there.
You wish there was no negotiating so it would all be more fair? I feel you, but it’s not happening.
Instead, negotiate hard, use your privilege, and then go and share numbers with your underrepresented and underpaid colleagues. […]
