It often takes several months of work to truly test an idea. Asking a mentor is a cheap proxy.
An important part of growing as a researcher is developing research taste. But it can be hard to explicitly work on. So I wanted to share some concrete exercises for developing research taste.
(Take my advice with a grain of salt! Note version: https://t.co/2BhyxOKy3q )
It often takes several months of work to truly test an idea. Asking a mentor is a cheap proxy.
Bonus: If you have a great interview, you might consider writing it up with their permission.
(Kuhn’s “The Structure of Scientific Revolutions” is one of my favorite books, and you can get an audio book!)
eg. In what ways has your own research taste or your community's taste been wrong in the past?
A lot of researchers start working on one problem (often more due to circumstance than contemplated decision) and then find it hard to move on.
Theoretical knowledge is table stakes for research taste. You can’t have research taste in a vacuum.
Research Intimacy: Internalizing obscure knowledge, equations, relationships, and ways of thinking related to a research topic.
— Chris Olah (@ch402) August 16, 2020
I sometimes talk to PhD students who have different interests than their advisor, and are trying to contort their research interests into something their advisor will find palatable.
More from For later read


Wow, Morgan McSweeney again, Rachel Riley, SFFN, Center for Countering Digital Hate, Imran Ahmed, JLM, BoD, Angela Eagle, Tracy-Ann Oberman, Lisa Nandy, Steve Reed, Jon Cruddas, Trevor Chinn, Martin Taylor, Lord Ian Austin and Mark Lewis. #LabourLeaks #StarmerOut 24 tweet🧵
Morgan McSweeney, Keir Starmer’s chief of staff, launched the organisation that now runs SFFN.
The CEO Imran Ahmed worked closely with a number of Labour figures involved in the campaign to remove Jeremy as leader.
Rachel Riley is listed as patron. https://t.co/nGY5QrwBD0

SFFN claims that it has been “a project of the Center For Countering Digital Hate” since 4 May 2020. The relationship between the two organisations, however, appears to date back far longer. And crucially, CCDH is linked to a number of figures on the Labour right. #LabourLeaks
Center for Countering Digital Hate registered at Companies House on 19 Oct 2018, the organisation’s only director was Morgan McSweeney – Labour leader Keir Starmer’s chief of staff. McSweeney was also the campaign manager for Liz Kendall’s leadership bid. #LabourLeaks #StarmerOut
Sir Keir - along with his chief of staff, Morgan McSweeney - held his first meeting with the Jewish Labour Movement (JLM). Deliberately used the “anti-Semitism” crisis as a pretext to vilify and then expel a leading pro-Corbyn activist in Brighton and Hove
Morgan McSweeney, Keir Starmer’s chief of staff, launched the organisation that now runs SFFN.
The CEO Imran Ahmed worked closely with a number of Labour figures involved in the campaign to remove Jeremy as leader.
Rachel Riley is listed as patron. https://t.co/nGY5QrwBD0
SFFN claims that it has been “a project of the Center For Countering Digital Hate” since 4 May 2020. The relationship between the two organisations, however, appears to date back far longer. And crucially, CCDH is linked to a number of figures on the Labour right. #LabourLeaks
Center for Countering Digital Hate registered at Companies House on 19 Oct 2018, the organisation’s only director was Morgan McSweeney – Labour leader Keir Starmer’s chief of staff. McSweeney was also the campaign manager for Liz Kendall’s leadership bid. #LabourLeaks #StarmerOut
Sir Keir - along with his chief of staff, Morgan McSweeney - held his first meeting with the Jewish Labour Movement (JLM). Deliberately used the “anti-Semitism” crisis as a pretext to vilify and then expel a leading pro-Corbyn activist in Brighton and Hove


(1/50)
#Cardano “Understanding Kamali”
#Cardano will be the underpinning of the emergence of Africa.
To grasp the full weight of the SOLUTIONS #Cardano can provide it is pertinent to read “Understanding Africa” as I will draw directly from the PROBLEMS laid out.

(2/50)
Here is a link if you have not already read
(3/50)
What I will attempt to do here, is to create an immersive world for you to be placed in to grasp the weight and size of problems from the ground level and then take a grass-roots approach at solving them using #Cardano and its technology.
(4/50)
As an investor and community member of #Cardano, this should be extremely important to you as you have a stake (pun intended) in this.
“You are paid in direct proportion to the difficulty of the problems you solve” - @elonmusk
(5/50)
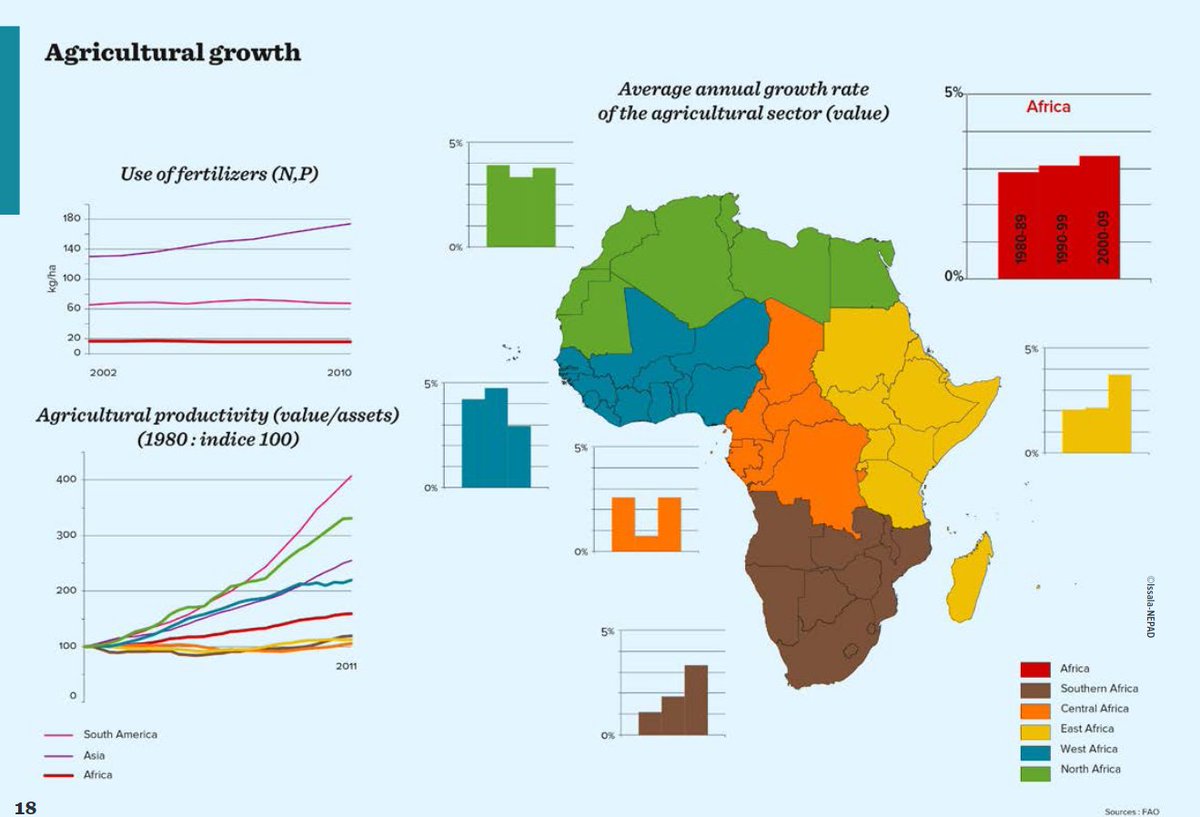
In Africa, agribusiness, more than any other sector, has the potential to reduce poverty and drive economic growth. Agriculture accounts for nearly half of the continent’s gross domestic product and employs 60 percent of the labor force.
#Cardano “Understanding Kamali”
#Cardano will be the underpinning of the emergence of Africa.
To grasp the full weight of the SOLUTIONS #Cardano can provide it is pertinent to read “Understanding Africa” as I will draw directly from the PROBLEMS laid out.
(2/50)
Here is a link if you have not already read
(1/38) #Cardano \u201cUnderstanding Africa\u201d (Part 1 of 2)
— FatCat (@fatcatofcrypto) February 10, 2021
This thread will be split into two parts with the 2nd coming out on Sunday.
Part 1 will layout the pervasive PROBLEMS Africa faces whereas Part 2 will apply direct technologies @InputOutputHK can implement as SOLUTIONS. pic.twitter.com/n3I91bnddq
(3/50)
What I will attempt to do here, is to create an immersive world for you to be placed in to grasp the weight and size of problems from the ground level and then take a grass-roots approach at solving them using #Cardano and its technology.
(4/50)
As an investor and community member of #Cardano, this should be extremely important to you as you have a stake (pun intended) in this.
“You are paid in direct proportion to the difficulty of the problems you solve” - @elonmusk
(5/50)
In Africa, agribusiness, more than any other sector, has the potential to reduce poverty and drive economic growth. Agriculture accounts for nearly half of the continent’s gross domestic product and employs 60 percent of the labor force.

the whole point of Dunks was you could go cop them at VIM whenever you wanted for $65. this shit is like having to enter a raffle to buy milk.
like seriously why not make a ton more of them if they're gonna be so sought-after? they land at outlets? so? nike still makes money off that.
the only reason to keep making them so limited is that they KNOW all that matters is the profit on the flip and if they were readily available FEWER people would want them, not more
the whole system is super broken, but it's just gonna go the way it goes, because at this point it all caters to the secondary market. the only reason Nike can sell Jordan 1s for $200 is because the people buying them can flip them for $500
adjusted for inflation, a $65 AJ1 in 1985 is like $160—and modern-day AJ1s are made from cheaper materials in factories staffed by cheaper workers. they don't HAVE to be $200 retail. but the secondary market nuked the whole concept of what sneakers are "worth"
\U0001f91e ONLINE RAFFLE is available from @bodega for the upcoming "UNLV" Nike Dunk Low Retro. Open until 5 PM ET on 2/16.
— Kicks Deals (@KicksDeals) February 15, 2021
\u27a1\ufe0f\u27a1\ufe0f https://t.co/JxJlyPuJVo pic.twitter.com/zenWOCDg4L
like seriously why not make a ton more of them if they're gonna be so sought-after? they land at outlets? so? nike still makes money off that.
the only reason to keep making them so limited is that they KNOW all that matters is the profit on the flip and if they were readily available FEWER people would want them, not more
the whole system is super broken, but it's just gonna go the way it goes, because at this point it all caters to the secondary market. the only reason Nike can sell Jordan 1s for $200 is because the people buying them can flip them for $500
adjusted for inflation, a $65 AJ1 in 1985 is like $160—and modern-day AJ1s are made from cheaper materials in factories staffed by cheaper workers. they don't HAVE to be $200 retail. but the secondary market nuked the whole concept of what sneakers are "worth"