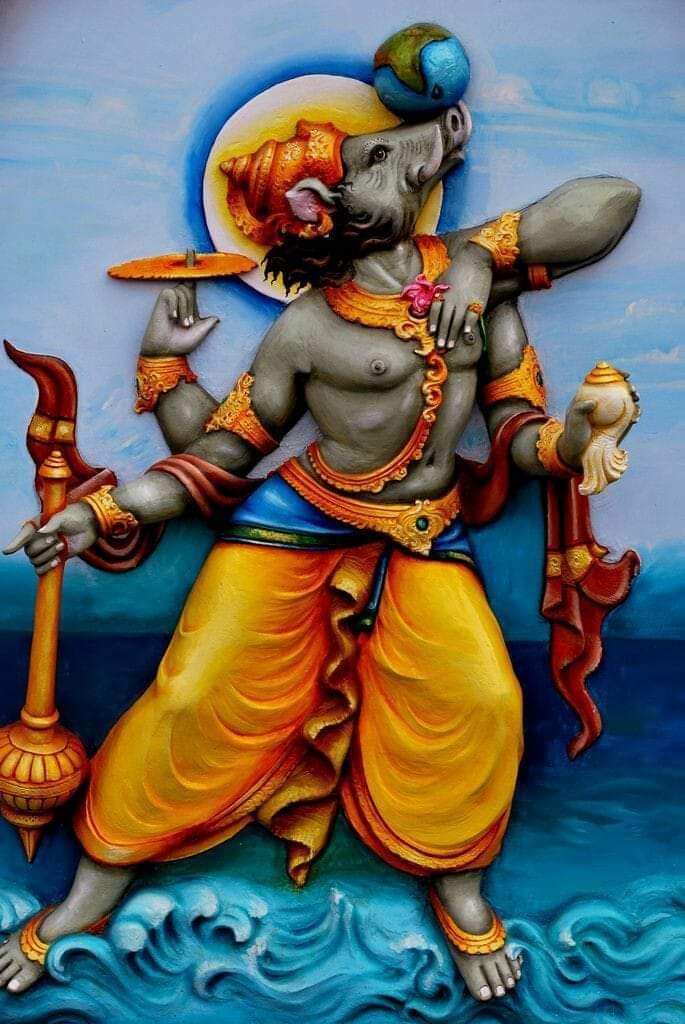
2/50
This year has been quite something.
But let's try to pick some of the most clownish stories this year had to offer.
Here's to 2020's end of year thread 1/50
More from Finance
Thread: P&F Super Pattern
An effective price pattern defined using properties of P&F charts.
#Superpattern #Pointandfigure #Definedge
Point & Figure is an oldest charting method where price is plotted vertically, and the chart moves only when price moves. It is a different way of looking at the price, the objective box-value and reversal value offers advantage of identifying objective price patterns.
When price is moving up, it is plotted in a column of 'X'. When it is going down, it is plotted in a column of ‘O’. Normally, three-box reversal criteria is used to define the trend & reversal. Unlike a bar or candle, the P&F column can have multiple sessions in it.
Link to know more about the subject:
https://t.co/2xtLAVPBvm
See below chart. Price is in a strong uptrend, P&F chart would produce a long of column of 'X' with more number of boxes in it.
If such a trend is followed by some time bars without meaningful price correct, P&F chart would not move, and it will remain in column of 'X' in such a scenario.
Rule 4 : If buying a naked option, always ensure that implied volatility is low. This can be understood from the level of IV vis a vis historical IV levels. Use IVR or IVP etc.
For a naked option to make money, it's better if IV rises or at least stays flat.
This is a thread I wrote on IV, IVR etc
For a naked option to make money, it's better if IV rises or at least stays flat.
Rule 3 : DO NOT run or trade everything that moves. Focus on a few stocks and master them. When a move comes, make the max out of that move.
— Subhadip Nandy (@SubhadipNandy16) October 14, 2021
Example : in this crazy mkt, I did not even trade TataMotors this week. Stayed focussed on ITC and it gave good returns https://t.co/41wkugZg1I
This is a thread I wrote on IV, IVR etc
IV - A thread
— Subhadip Nandy (@SubhadipNandy16) September 20, 2018
In financial mathematics, implied volatility of an option contract is
that value of the volatility of the underlying instrument which, when
input in an option pricing model ) will return a theoretical value equal to the current market price of the option (1/n)