1/What is Fibonnaci (Fibo) retracement?:
•Fibo retracement levels help us to identify potential reversal area or identifying potential entry point after a pullback.
•It represents various levels of significance within a swing high and low.
2/How to plot the Fibo?
•Spot the recent swing high & swing low (usually a peak & a low) on a chart.
•Plot the Fibo on these points.
•You'll get 5 key levels of support & resistance (S/R) in between the peak & low.
•Key Fibonacci ratios: 23.6%, 38.2%, 50%, 61.8%, & 100%.
3/ Importance of retracement levels:
• The retracement level forecast can determine the level at which retracement is likely to occur.
• These retracement levels offer traders a favourable entry to open new trades in the direction of the trend.
4/ When to apply Fibo:
•Fibonacci analysis can be applied when there is a noticeable up-move or down-move in prices.
•Applying it in range bound markets would turn out to be a futile exercise.
5/ Best TF to use for Fibo:
•Though it can be used on any time frame, for better results apply it on a higher TF, anything beyond 30mins.
•Higher the TF you choose, higher would be the holding period for the trade.
•Best TF to choose: Know your type & trading style.
6/How I use Fibo Retracements?:
• I look at larger TF's only for positional trading/ investing.
• While choosing a stock to get an entry, then I will focus only on strong fundamental companies.
• Can be used to make investment decisions in sectoral MFs or Index BeES.
7/ Examples for buying: Stock
•Lets say, you always wanted to purchase few qty of #DMART, but were unable to do so due to a rapid run-up in the stock.
•So wait for the stock to retrace for a favourable entry.
•P.S.: Like any indicator, use this as a confirmation tool.
8/ Examples for buying: Index
• First use the Fibo tool and plot it on the swing low and pull it up till the swing high, thereafter the FIBO ratios will get plotted automatically.
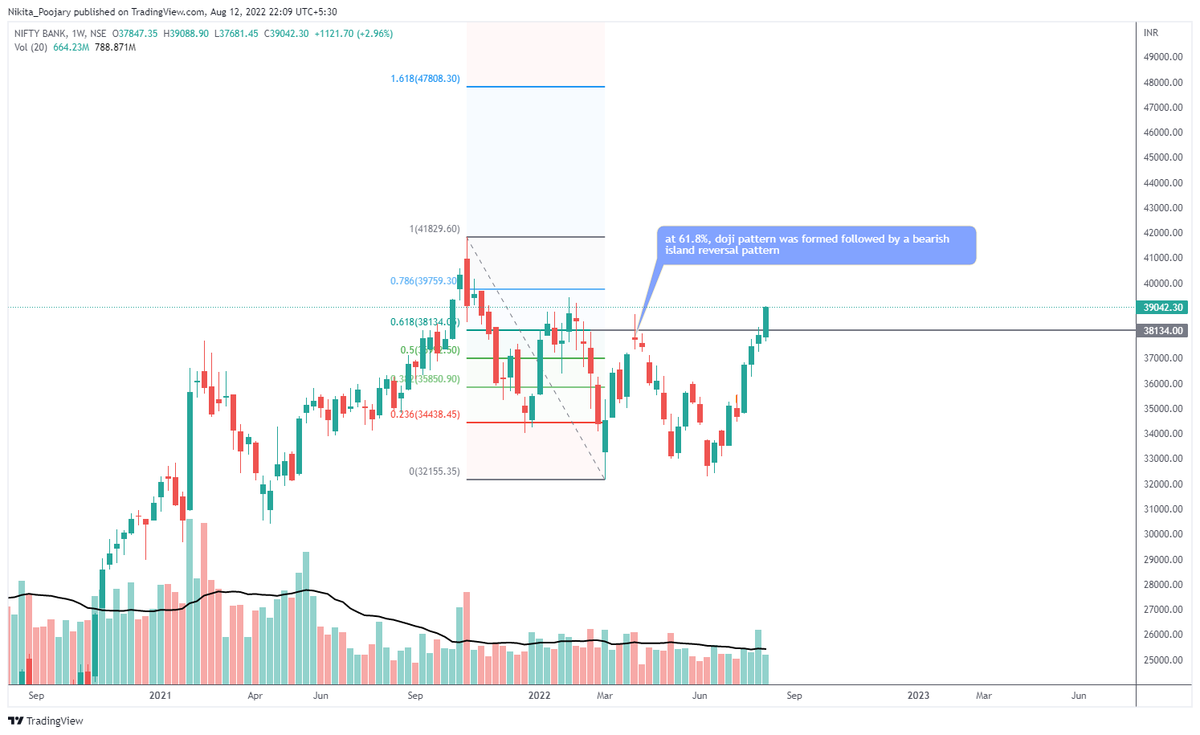
9/ Example to find resistance/ enter fresh sell trades in Index:
• Use the Fibo tool and plot it on the swing high and pull it up till the swing low, thereafter the FIBO ratios will get plotted automatically.
10/ Relevance of the key ratios:
• 23.6% retracement is rather shallow & is appropriate for flag breakouts or brief pullbacks.
• 61.8% retracement level, aka the golden ratio is relatively deeper, but crucial.
• Retracements between 38.2% to 50%, is regarded as moderate.
11/How pro traders use Fibo to initiate investing:
• Few months ago, one of the super trader
@bhatiamanu Sir, had tweeted that he would look to start investing near 13k levels on Nifty.
• This number was arrived from Fibo retracement (refer chart 2)
12/ How to identify weak sectors?
• Unlike Nifty, which didn't even retrace by 38.2%,there are sectors which have retraced > 38.2%
•In other words the correction was relatively deeper than Nifty.
• Those sectors are essentially underperformers:
i) NIFTYIT
ii) NIFTYPHARMA
13/Conclusion:
• A trader can consider taking entry basis Fibonacci retracement only when other conditions are also fulfilled:
i)Formation of a reversal pattern
ii)The pattern formation & the retracement level should form near the long term S/R.
iii)Always have a Stop loss.
14/Few key points to remember:
• This is just the tip of the iceberg when it comes to Fibo retracement.
• I encourage you to do some back testing of your own on different TF's and check the results before taking entries.
• Also remember nothing works in isolation.
If you enjoyed this thread, here's another one which might be helpful:
https://t.co/81q0VY7PF6
Hope you discovered something new (because that's the point!)
If you did, share it with a friend
Hop back up to retweet the first tweet
See past threads here:
@AdityaTodmal &
@niki_poojary