Nippon India Nifty Pharma ETF list today.
NSE symbol: NETFPHARMA
Issue price: Rs.14.54
#ETF
More from India ETFs & Index Funds
More from Etf
Important.
Whenever you invest in Fund of funds, check the expense ratios of both the local fund & the global fund which is investing into.
e.g., Nasdaq FOF ER is 0.1%, but you have to add the ER of ETF which 0.54%, total 0.64%
Good to see AMCs like @EdelweissMF mentioning it.
Whenever you invest in Fund of funds, check the expense ratios of both the local fund & the global fund which is investing into.
e.g., Nasdaq FOF ER is 0.1%, but you have to add the ER of ETF which 0.54%, total 0.64%
Good to see AMCs like @EdelweissMF mentioning it.
When you invest in a global fund, and compare expenses across funds:
— Radhika Gupta (@iRadhikaGupta) June 22, 2021
1. Compare \U0001f34e to \U0001f34e: Total cost includes offshore fund cost plus what local AMC charges.
2. Get this data from the AMC website. Many 3rd party websites don\u2019t include underlying fund costs.
1/3
You May Also Like
Nano Course On Python For Trading
==========================
Module 1
Python makes it very easy to analyze and visualize time series data when you’re a beginner. It's easier when you don't have to install python on your PC (that's why it's a nano course, you'll learn python...
... on the go). You will not be required to install python in your PC but you will be using an amazing python editor, Google Colab Visit https://t.co/EZt0agsdlV
This course is for anyone out there who is confused, frustrated, and just wants this python/finance thing to work!
In Module 1 of this Nano course, we will learn about :
# Using Google Colab
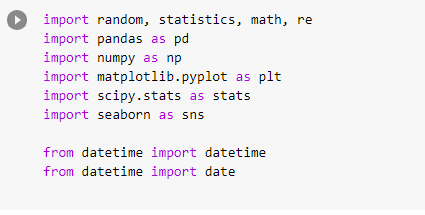
# Importing libraries
# Making a Random Time Series of Black Field Research Stock (fictional)
# Using Google Colab
Intro link is here on YT: https://t.co/MqMSDBaQri
Create a new Notebook at https://t.co/EZt0agsdlV and name it AnythingOfYourChoice.ipynb
You got your notebook ready and now the game is on!
You can add code in these cells and add as many cells as you want
# Importing Libraries
Imports are pretty standard, with a few exceptions.
For the most part, you can import your libraries by running the import.
Type this in the first cell you see. You need not worry about what each of these does, we will understand it later.


