

November Jobs Report Thread
There is both good news and bad news buried in the report.
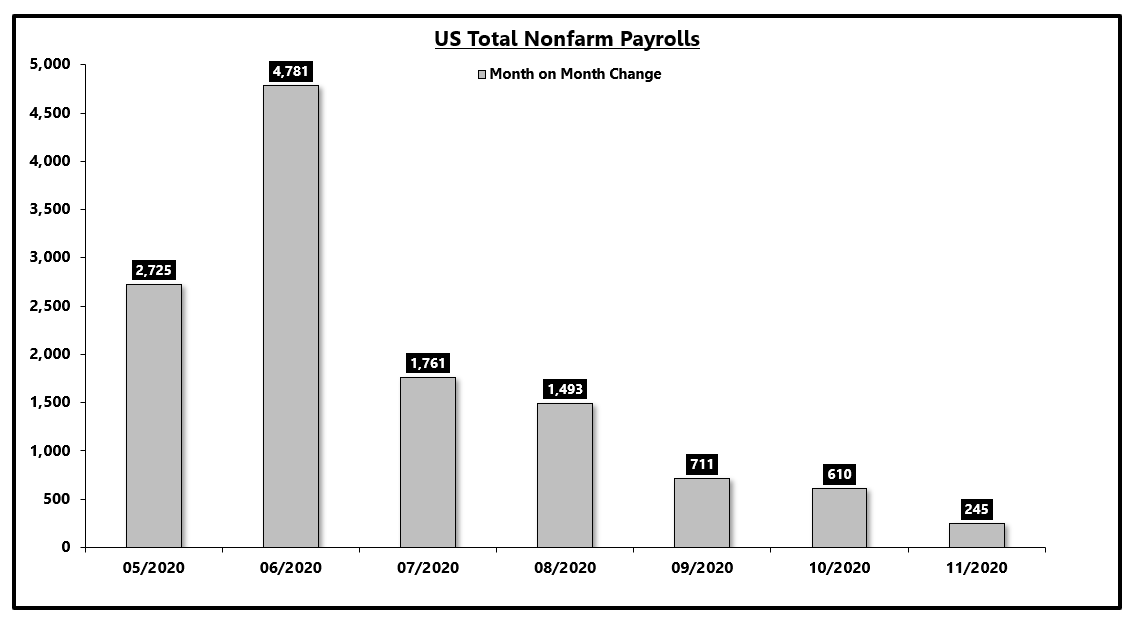
Most often, too much attention is paid to the headline month on month numbers.
1)
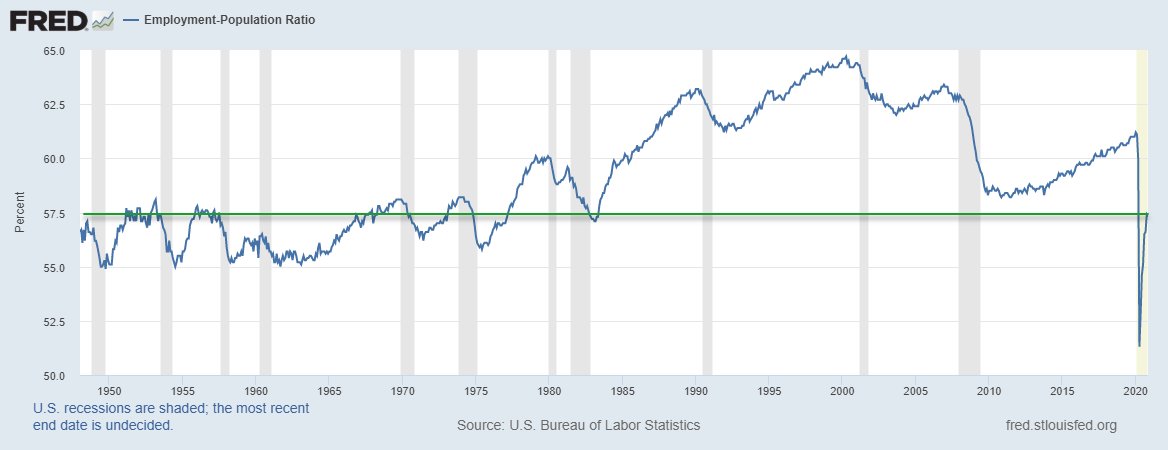
As @R_Perli highlighted, if the LFPR does not increase back to pre-COVID levels, we're going to struggle with weaker trend potential growth.
https://t.co/zw7fCZ2gfY
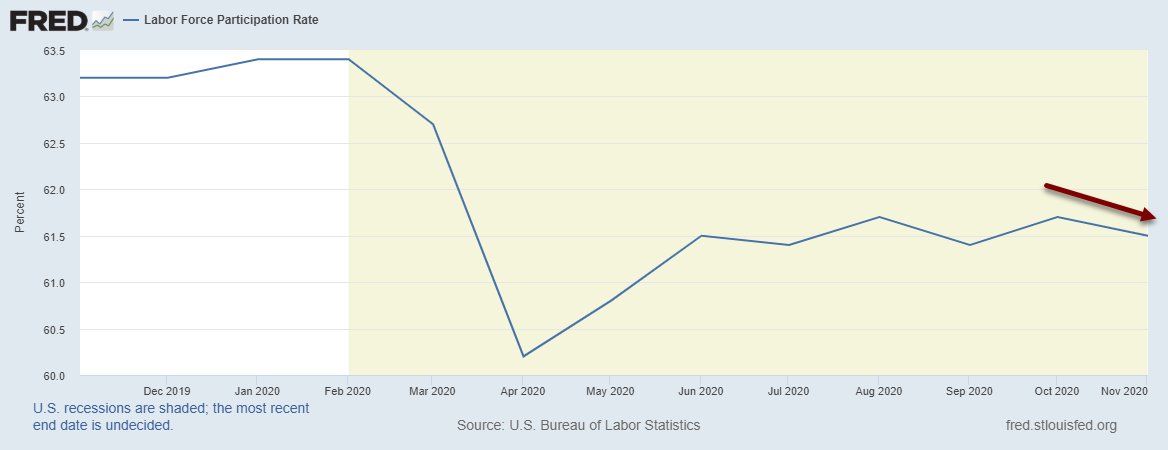
The worst part of the employment report is the stall in the labor force participation rate (-0.2% today and about 2% lower than pre-#COVID19).
— Roberto Perli (@R_Perli) December 4, 2020
The longer participation stays depressed, the harder it will be to bring those workers back, and the lower potential growth will be. pic.twitter.com/7u966oxBME

This is a structural issue and not totally related to demographics either.
https://t.co/Lxn4g7VyLh
The first year after a recession the snap back is pretty strong vs the decline. Macro tourists get excited and confuse it with a new paradigm. It\u2019s not. After the first year the economy changes gears and settles into its structural growth trend, people confuse that shift too
— GreekFire23 (@GreekFire23) December 4, 2020
We have a growth upturn at the moment so we can ignore the LT trend, but only temporarily.
End.
More from Economy


The argument for deficits & debt raising interest rates in the US is not increased credit risk, it is that interest rates are a function of economic fundamentals, flows & policy. Deficits/debt change those.
I can't tell if I'm agreeing or disagreeing with @jc_econ.
Increasing government spending or reducing taxes increases demand (or reduces saving). This raises the price of loanable funds or the interest rate.
In a dynamic context, more demand means a stronger economy, the central bank raises interest rates sooner, and long rates rise.
(As an aside, we are not close to the United States needing to worry about credit risk and the risks are more overstated than understated in most other advanced economies too. But credit risk is not always & everywhere irrelevant, just look at the UK in 1976 or Canada in 1994.)
Interest rates have fallen over the last 20 yrs while debt has risen. This does not necessarily mean that debt rising causes interest rates to fall. It could also mean that other things have happened at he same time that pushed down interest rates more than debt pushed them up.
The suspects for these "other things" include slower productivity growth, slower popln growth, higher inequality, less investment, etc. All of which either increase the supply of saving or reduce the demand for investment, reducing the equilibrium interest rate.
I can't tell if I'm agreeing or disagreeing with @jc_econ.
There is no relationship b/w deficits & interest rates in the US & many other advanced economies. Centuries of dynamic institution building underpin our reserve currency status that allows rates to be a function of economic fundamentals, flows & policy not credit risk 1/3
— Dr. Julia Coronado (@jc_econ) January 26, 2021
Increasing government spending or reducing taxes increases demand (or reduces saving). This raises the price of loanable funds or the interest rate.
In a dynamic context, more demand means a stronger economy, the central bank raises interest rates sooner, and long rates rise.
(As an aside, we are not close to the United States needing to worry about credit risk and the risks are more overstated than understated in most other advanced economies too. But credit risk is not always & everywhere irrelevant, just look at the UK in 1976 or Canada in 1994.)
Interest rates have fallen over the last 20 yrs while debt has risen. This does not necessarily mean that debt rising causes interest rates to fall. It could also mean that other things have happened at he same time that pushed down interest rates more than debt pushed them up.
The suspects for these "other things" include slower productivity growth, slower popln growth, higher inequality, less investment, etc. All of which either increase the supply of saving or reduce the demand for investment, reducing the equilibrium interest rate.


